
Popular Posts
How to Distinguish Between a True Breakout and a False Breakout at Resistance
Understanding the difference between a genuine breakout and a false one is essential for traders, especially in volatile markets like cryptocurrencies. Making informed decisions can prevent costly mistakes and improve your overall trading strategy. This guide explores key indicators, chart patterns, market sentiment factors, and recent developments that help traders identify whether a breakout at resistance is real or just a fleeting move.
What Is a Resistance Level in Technical Analysis?
In technical analysis, resistance refers to a price point where an asset's upward movement tends to pause or reverse due to increased selling pressure. Traders often view resistance levels as barriers that the price struggles to break through. When the price approaches this level, it signals potential trading opportunities—either for continuation if it breaks through or for reversal if it bounces back.
A breakout occurs when the price moves above this resistance level with significant momentum. Such movements are often seen as signals of strong buying interest and potential trend shifts upward. Conversely, false breakouts happen when prices temporarily breach resistance but then quickly fall back below it, trapping traders who entered positions expecting continued upward movement.
Key Technical Indicators for Identifying Breakouts
Technical indicators are vital tools that help traders assess whether a breakout is likely genuine or false. Here are some of the most effective:
Moving Averages
Moving averages smooth out price data over specific periods (e.g., 20-day or 50-day) and help identify trend direction. During true breakouts, prices tend to stay above key moving averages after crossing them convincingly. If the price briefly crosses above resistance but then reverts below these averages shortly after, it's often indicative of a false breakout.
Relative Strength Index (RSI)
The RSI measures momentum on a scale from 0 to 100; readings above 70 suggest overbought conditions while below 30 indicate oversold states. When assessing breakouts:
- A true breakout typically sees RSI rising above 50 with sustained momentum.
- A false breakout might show RSI crossing above 50 momentarily but failing to maintain strength before reverting.
Bollinger Bands
These bands adjust based on market volatility—widening during high volatility and narrowing during consolidation phases.
- In genuine breakouts, prices usually move outside the upper band with increased volume.
- False breakouts may see prices touching or slightly exceeding the upper band temporarily but quickly returning within bands without significant volume support.
Recognizing Chart Patterns That Signal Breakout Validity
Chart patterns provide visual cues about potential trend continuations or reversals:
Head and Shoulders Pattern
This pattern indicates possible reversals from bullish to bearish trends (or vice versa). After completing this pattern:
- A confirmed true breakout occurs when prices surpass the neckline with strong volume.
- An incomplete pattern or one accompanied by low volume may lead to false signals.
Triangular Patterns (Symmetrical Triangles)
These represent consolidation phases where buyers and sellers reach equilibrium before breaking out:
- A valid triangle breakout involves clear movement outside of triangle boundaries accompanied by higher-than-average volume.
- If prices only briefly pierce these boundaries without follow-through activity—or do so on low volume—it suggests an unreliable signal prone to reversal.
Market Sentiment Factors Influencing Breakout Reliability
Market sentiment plays an influential role in whether breakouts turn out authentic:
Impact of News & Events
Major news releases—such as regulatory announcements, technological upgrades in blockchain projects, or macroeconomic developments—can trigger rapid moves that appear as breakouts:
- Genuine reactions tend to be supported by sustained momentum.
- Fake reactions often occur due to rumors or speculative hype that dissipate once clarified.
Market Volatility & Manipulation Risks
High volatility environments increase chances of false signals because rapid swings can trigger temporary breaches of resistance levels:
- Traders should watch for sudden spikes driven by large trades designed intentionally (market manipulation), which can create artificial breakouts meant solely for deceiving other participants—a common tactic in crypto markets like pump-and-dump schemes.
Practical Strategies To Confirm True Breakouts
To avoid falling victim to false signals:
- Use Confirmation Signals: Wait for additional confirmation such as increased trading volume alongside price movement beyond resistance levels.
- Set Stop-Loss Orders: Protect yourself from sudden reversals by placing stop-loss orders just below recent support levels.
- Observe Price Action: Look for steady upward movement rather than sharp spikes followed by quick retracements.
- Monitor Multiple Indicators: Rely on several technical tools simultaneously rather than single indicators alone; convergence increases confidence in validity.
- Be Patient: Avoid rushing into trades immediately after initial breach attempts; patience allows clearer differentiation between true trends and fake-outs.
Recent Trends Enhancing Detection Capabilities
Advancements in technology have improved how traders analyze potential breakouts:
AI-Powered Trading Platforms: These systems analyze vast datasets—including historical patterns—and provide probabilistic assessments about whether upcoming movements are likely genuine based on complex algorithms trained on market behavior data.
Enhanced Charting Tools: Modern platforms offer more detailed visualizations such as heatmaps indicating trader activity levels around key levels—helping identify manipulation attempts versus organic moves.
Increased Awareness About Market Manipulation: Regulatory scrutiny has risen globally against practices like pump-and-dump schemes prevalent among smaller altcoins; awareness helps traders approach suspected fake-outs more cautiously.
Risks Associated With False Breakouts
Misinterpreting false breakthroughs can have serious consequences:
- Financial Losses: Entering trades prematurely based on unreliable signals leads directly into losses once prices revert back within previous ranges.2.. Eroded Confidence: Repeated failures diminish trader confidence—not only affecting individual strategies but also impacting overall market stability if many participants react similarly.3.. Regulatory Scrutiny: Persistent manipulative practices attracting regulatory attention could result in penalties against involved parties—and potentially impact legitimate investors' trustworthiness perceptions.
By understanding technical indicators like moving averages and RSI alongside chart patterns such as triangles—and considering external factors like news sentiment—you can significantly improve your ability to distinguish between true and false breakouts at resistance levels within cryptocurrency markets—or any financial asset class you trade actively.
Final Tips
Always combine multiple analytical methods before acting upon any perceived breakthrough signal; patience combined with disciplined risk management remains your best defense against deceptive market moves rooted in fake-out scenarios.


JCUSER-IC8sJL1q
2025-05-09 04:01
How can you distinguish between a true breakout and a false breakout at resistance?
How to Distinguish Between a True Breakout and a False Breakout at Resistance
Understanding the difference between a genuine breakout and a false one is essential for traders, especially in volatile markets like cryptocurrencies. Making informed decisions can prevent costly mistakes and improve your overall trading strategy. This guide explores key indicators, chart patterns, market sentiment factors, and recent developments that help traders identify whether a breakout at resistance is real or just a fleeting move.
What Is a Resistance Level in Technical Analysis?
In technical analysis, resistance refers to a price point where an asset's upward movement tends to pause or reverse due to increased selling pressure. Traders often view resistance levels as barriers that the price struggles to break through. When the price approaches this level, it signals potential trading opportunities—either for continuation if it breaks through or for reversal if it bounces back.
A breakout occurs when the price moves above this resistance level with significant momentum. Such movements are often seen as signals of strong buying interest and potential trend shifts upward. Conversely, false breakouts happen when prices temporarily breach resistance but then quickly fall back below it, trapping traders who entered positions expecting continued upward movement.
Key Technical Indicators for Identifying Breakouts
Technical indicators are vital tools that help traders assess whether a breakout is likely genuine or false. Here are some of the most effective:
Moving Averages
Moving averages smooth out price data over specific periods (e.g., 20-day or 50-day) and help identify trend direction. During true breakouts, prices tend to stay above key moving averages after crossing them convincingly. If the price briefly crosses above resistance but then reverts below these averages shortly after, it's often indicative of a false breakout.
Relative Strength Index (RSI)
The RSI measures momentum on a scale from 0 to 100; readings above 70 suggest overbought conditions while below 30 indicate oversold states. When assessing breakouts:
- A true breakout typically sees RSI rising above 50 with sustained momentum.
- A false breakout might show RSI crossing above 50 momentarily but failing to maintain strength before reverting.
Bollinger Bands
These bands adjust based on market volatility—widening during high volatility and narrowing during consolidation phases.
- In genuine breakouts, prices usually move outside the upper band with increased volume.
- False breakouts may see prices touching or slightly exceeding the upper band temporarily but quickly returning within bands without significant volume support.
Recognizing Chart Patterns That Signal Breakout Validity
Chart patterns provide visual cues about potential trend continuations or reversals:
Head and Shoulders Pattern
This pattern indicates possible reversals from bullish to bearish trends (or vice versa). After completing this pattern:
- A confirmed true breakout occurs when prices surpass the neckline with strong volume.
- An incomplete pattern or one accompanied by low volume may lead to false signals.
Triangular Patterns (Symmetrical Triangles)
These represent consolidation phases where buyers and sellers reach equilibrium before breaking out:
- A valid triangle breakout involves clear movement outside of triangle boundaries accompanied by higher-than-average volume.
- If prices only briefly pierce these boundaries without follow-through activity—or do so on low volume—it suggests an unreliable signal prone to reversal.
Market Sentiment Factors Influencing Breakout Reliability
Market sentiment plays an influential role in whether breakouts turn out authentic:
Impact of News & Events
Major news releases—such as regulatory announcements, technological upgrades in blockchain projects, or macroeconomic developments—can trigger rapid moves that appear as breakouts:
- Genuine reactions tend to be supported by sustained momentum.
- Fake reactions often occur due to rumors or speculative hype that dissipate once clarified.
Market Volatility & Manipulation Risks
High volatility environments increase chances of false signals because rapid swings can trigger temporary breaches of resistance levels:
- Traders should watch for sudden spikes driven by large trades designed intentionally (market manipulation), which can create artificial breakouts meant solely for deceiving other participants—a common tactic in crypto markets like pump-and-dump schemes.
Practical Strategies To Confirm True Breakouts
To avoid falling victim to false signals:
- Use Confirmation Signals: Wait for additional confirmation such as increased trading volume alongside price movement beyond resistance levels.
- Set Stop-Loss Orders: Protect yourself from sudden reversals by placing stop-loss orders just below recent support levels.
- Observe Price Action: Look for steady upward movement rather than sharp spikes followed by quick retracements.
- Monitor Multiple Indicators: Rely on several technical tools simultaneously rather than single indicators alone; convergence increases confidence in validity.
- Be Patient: Avoid rushing into trades immediately after initial breach attempts; patience allows clearer differentiation between true trends and fake-outs.
Recent Trends Enhancing Detection Capabilities
Advancements in technology have improved how traders analyze potential breakouts:
AI-Powered Trading Platforms: These systems analyze vast datasets—including historical patterns—and provide probabilistic assessments about whether upcoming movements are likely genuine based on complex algorithms trained on market behavior data.
Enhanced Charting Tools: Modern platforms offer more detailed visualizations such as heatmaps indicating trader activity levels around key levels—helping identify manipulation attempts versus organic moves.
Increased Awareness About Market Manipulation: Regulatory scrutiny has risen globally against practices like pump-and-dump schemes prevalent among smaller altcoins; awareness helps traders approach suspected fake-outs more cautiously.
Risks Associated With False Breakouts
Misinterpreting false breakthroughs can have serious consequences:
- Financial Losses: Entering trades prematurely based on unreliable signals leads directly into losses once prices revert back within previous ranges.2.. Eroded Confidence: Repeated failures diminish trader confidence—not only affecting individual strategies but also impacting overall market stability if many participants react similarly.3.. Regulatory Scrutiny: Persistent manipulative practices attracting regulatory attention could result in penalties against involved parties—and potentially impact legitimate investors' trustworthiness perceptions.
By understanding technical indicators like moving averages and RSI alongside chart patterns such as triangles—and considering external factors like news sentiment—you can significantly improve your ability to distinguish between true and false breakouts at resistance levels within cryptocurrency markets—or any financial asset class you trade actively.
Final Tips
Always combine multiple analytical methods before acting upon any perceived breakthrough signal; patience combined with disciplined risk management remains your best defense against deceptive market moves rooted in fake-out scenarios.
Disclaimer:Contains third-party content. Not financial advice.
See Terms and Conditions.
What Is the Future of Solana in Blockchain and DeFi?
Solana has rapidly emerged as a leading blockchain platform, capturing attention with its high throughput, low latency, and innovative consensus mechanism. As the landscape of decentralized finance (DeFi) continues to evolve, many investors and developers are asking: what does the future hold for Solana? This article explores Solana’s current position, recent developments, challenges, and potential trajectory within the broader blockchain ecosystem.
Understanding Solana’s Technology and Ecosystem
Launched in 2017 by Anatoly Yakovenko along with Greg Fitzgerald and Stephen Akridge, Solana was designed to address common scalability issues faced by earlier blockchains like Bitcoin and Ethereum. Its core innovation is the Proof of History (PoH) consensus algorithm—a unique timestamping method that enables faster transaction processing without compromising security.
This architecture allows Solana to process thousands of transactions per second (TPS), making it highly suitable for applications requiring high throughput such as DeFi protocols, non-fungible tokens (NFTs), gaming platforms, and enterprise solutions. Its ability to scale efficiently positions it as a formidable competitor in an increasingly crowded market dominated by Ethereum but challenged by newer entrants like Binance Smart Chain or Polkadot.
The platform's robust ecosystem includes a variety of decentralized applications—ranging from lending protocols to stablecoins—and has attracted significant institutional interest. Notably, major players have invested millions into projects built on or related to Solana—highlighting confidence in its long-term potential.
Recent Price Movements Indicate Growing Adoption
As of May 2025, Solana’s native token SOL experienced a notable surge past $150 amid heightened trading activity. This price rally reflects increased investor confidence driven by several factors:
- Institutional Investment: The launch of financial products such as the SOLZ ETF has garnered attention from institutional investors. Bloomberg predicts high approval rates for these ETFs amid favorable regulatory trends.
- Ecosystem Expansion: New projects launching on Solana—including DeFi platforms offering yield farming or lending services—have contributed to demand.
- Market Sentiment: Broader bullish trends across cryptocurrencies have also played a role in boosting SOL prices temporarily.
However, analysts warn that this rally could be susceptible to short-term volatility due to macroeconomic factors affecting global markets or shifts within crypto sentiment itself.
Regulatory Environment: Opportunities & Risks
The evolving regulatory landscape remains one of the most critical factors influencing Solana's future prospects. While clarity around cryptocurrency regulations can foster investor confidence—and potentially lead to mainstream adoption—any adverse policy changes could hinder growth prospects significantly.
In 2025 alone, regulators worldwide are scrutinizing digital assets more closely; some countries have introduced stricter compliance requirements while others explore central bank digital currencies (CBDCs). For platforms like Solana that host numerous dApps—including those involved with DeFi—the risk lies in potential restrictions on certain activities such as yield farming or token issuance.
Nevertheless, proactive engagement with regulators coupled with transparent compliance strategies can help mitigate these risks over time.
Institutional Interest Signaling Long-Term Confidence
One notable development is Neptune Digital Assets Corp.'s increased holdings in Bitcoin alongside investments in Solana-based projects. Such moves suggest growing institutional recognition that blockchain ecosystems like Solana may offer sustainable growth opportunities beyond retail speculation alone.
Institutional backing often translates into greater liquidity support and credibility for blockchain networks—factors crucial for long-term success especially when competing against well-established chains like Ethereum which benefits from extensive developer communities but faces scalability issues itself.
Furthermore, large-scale investments tend to attract more developers seeking reliable infrastructure for their decentralized applications—a positive feedback loop reinforcing network effects over time.
Challenges Facing Future Growth
Despite promising signs ahead; several hurdles could impact how farSolano can go:
Market Volatility: Cryptocurrency markets are inherently volatile; sharp corrections can affect investor sentiment regardless of underlying technology.
Competition: Platforms such as Ethereum 2.0 upgrade efforts aim at improving scalability but still face congestion issues; Binance Smart Chain offers lower fees but less decentralization; Polkadot emphasizes interoperability—all vying for market share.
Security Concerns: As more complex dApps emerge on solanA’s network—including meme coins like $TRUMP launched early 2025—the risk profile increases regarding smart contract vulnerabilities or malicious attacks.
Addressing these challenges requires ongoing technological innovation combined with strategic community engagement and regulatory compliance efforts.
The Road Ahead: Will Solarna Maintain Its Momentum?
Looking forward into 2025+ , several key factors will influence whether solanA sustains its current momentum:
- Continued Ecosystem Development: Expanding partnerships with enterprises and onboarding new developers will be vital.
- Regulatory Adaptation: Navigating evolving legal frameworks effectively can prevent setbacks caused by policy shifts.
- Technological Innovation: Upgrades enhancing security features while maintaining speed will reinforce trust among users.
- Market Conditions: Broader economic stability may reduce volatility-driven sell-offs enabling steady growth trajectories.
While no project is immune from risks inherent within crypto markets; solanA's innovative architecture combined with increasing institutional interest suggests it could remain at the forefront among scalable Layer 1 blockchains if it manages these dynamics well.
Final Thoughts
Solano stands out today not just because of its impressive technical capabilities but also due to growing adoption across sectors—from DeFi protocols through NFTs—to enterprise use cases . Its ability to adapt amidst competition hinges on continuous innovation paired with strategic regulation navigation .
As we move further into this decade marked by rapid technological change , solanA's future appears promising—but cautious optimism remains prudent given inherent market uncertainties . Stakeholders should monitor ongoing developments closely while leveraging its strengths toward building resilient decentralized ecosystems.
Note: This overview aims at providing an informed perspective based on current data up until October 2023 plus recent developments noted through early 2025 — always consider ongoing updates when evaluating long-term prospects
JCUSER-F1IIaxXA
2025-05-09 03:47
what is the future of Solana ?
What Is the Future of Solana in Blockchain and DeFi?
Solana has rapidly emerged as a leading blockchain platform, capturing attention with its high throughput, low latency, and innovative consensus mechanism. As the landscape of decentralized finance (DeFi) continues to evolve, many investors and developers are asking: what does the future hold for Solana? This article explores Solana’s current position, recent developments, challenges, and potential trajectory within the broader blockchain ecosystem.
Understanding Solana’s Technology and Ecosystem
Launched in 2017 by Anatoly Yakovenko along with Greg Fitzgerald and Stephen Akridge, Solana was designed to address common scalability issues faced by earlier blockchains like Bitcoin and Ethereum. Its core innovation is the Proof of History (PoH) consensus algorithm—a unique timestamping method that enables faster transaction processing without compromising security.
This architecture allows Solana to process thousands of transactions per second (TPS), making it highly suitable for applications requiring high throughput such as DeFi protocols, non-fungible tokens (NFTs), gaming platforms, and enterprise solutions. Its ability to scale efficiently positions it as a formidable competitor in an increasingly crowded market dominated by Ethereum but challenged by newer entrants like Binance Smart Chain or Polkadot.
The platform's robust ecosystem includes a variety of decentralized applications—ranging from lending protocols to stablecoins—and has attracted significant institutional interest. Notably, major players have invested millions into projects built on or related to Solana—highlighting confidence in its long-term potential.
Recent Price Movements Indicate Growing Adoption
As of May 2025, Solana’s native token SOL experienced a notable surge past $150 amid heightened trading activity. This price rally reflects increased investor confidence driven by several factors:
- Institutional Investment: The launch of financial products such as the SOLZ ETF has garnered attention from institutional investors. Bloomberg predicts high approval rates for these ETFs amid favorable regulatory trends.
- Ecosystem Expansion: New projects launching on Solana—including DeFi platforms offering yield farming or lending services—have contributed to demand.
- Market Sentiment: Broader bullish trends across cryptocurrencies have also played a role in boosting SOL prices temporarily.
However, analysts warn that this rally could be susceptible to short-term volatility due to macroeconomic factors affecting global markets or shifts within crypto sentiment itself.
Regulatory Environment: Opportunities & Risks
The evolving regulatory landscape remains one of the most critical factors influencing Solana's future prospects. While clarity around cryptocurrency regulations can foster investor confidence—and potentially lead to mainstream adoption—any adverse policy changes could hinder growth prospects significantly.
In 2025 alone, regulators worldwide are scrutinizing digital assets more closely; some countries have introduced stricter compliance requirements while others explore central bank digital currencies (CBDCs). For platforms like Solana that host numerous dApps—including those involved with DeFi—the risk lies in potential restrictions on certain activities such as yield farming or token issuance.
Nevertheless, proactive engagement with regulators coupled with transparent compliance strategies can help mitigate these risks over time.
Institutional Interest Signaling Long-Term Confidence
One notable development is Neptune Digital Assets Corp.'s increased holdings in Bitcoin alongside investments in Solana-based projects. Such moves suggest growing institutional recognition that blockchain ecosystems like Solana may offer sustainable growth opportunities beyond retail speculation alone.
Institutional backing often translates into greater liquidity support and credibility for blockchain networks—factors crucial for long-term success especially when competing against well-established chains like Ethereum which benefits from extensive developer communities but faces scalability issues itself.
Furthermore, large-scale investments tend to attract more developers seeking reliable infrastructure for their decentralized applications—a positive feedback loop reinforcing network effects over time.
Challenges Facing Future Growth
Despite promising signs ahead; several hurdles could impact how farSolano can go:
Market Volatility: Cryptocurrency markets are inherently volatile; sharp corrections can affect investor sentiment regardless of underlying technology.
Competition: Platforms such as Ethereum 2.0 upgrade efforts aim at improving scalability but still face congestion issues; Binance Smart Chain offers lower fees but less decentralization; Polkadot emphasizes interoperability—all vying for market share.
Security Concerns: As more complex dApps emerge on solanA’s network—including meme coins like $TRUMP launched early 2025—the risk profile increases regarding smart contract vulnerabilities or malicious attacks.
Addressing these challenges requires ongoing technological innovation combined with strategic community engagement and regulatory compliance efforts.
The Road Ahead: Will Solarna Maintain Its Momentum?
Looking forward into 2025+ , several key factors will influence whether solanA sustains its current momentum:
- Continued Ecosystem Development: Expanding partnerships with enterprises and onboarding new developers will be vital.
- Regulatory Adaptation: Navigating evolving legal frameworks effectively can prevent setbacks caused by policy shifts.
- Technological Innovation: Upgrades enhancing security features while maintaining speed will reinforce trust among users.
- Market Conditions: Broader economic stability may reduce volatility-driven sell-offs enabling steady growth trajectories.
While no project is immune from risks inherent within crypto markets; solanA's innovative architecture combined with increasing institutional interest suggests it could remain at the forefront among scalable Layer 1 blockchains if it manages these dynamics well.
Final Thoughts
Solano stands out today not just because of its impressive technical capabilities but also due to growing adoption across sectors—from DeFi protocols through NFTs—to enterprise use cases . Its ability to adapt amidst competition hinges on continuous innovation paired with strategic regulation navigation .
As we move further into this decade marked by rapid technological change , solanA's future appears promising—but cautious optimism remains prudent given inherent market uncertainties . Stakeholders should monitor ongoing developments closely while leveraging its strengths toward building resilient decentralized ecosystems.
Note: This overview aims at providing an informed perspective based on current data up until October 2023 plus recent developments noted through early 2025 — always consider ongoing updates when evaluating long-term prospects
Disclaimer:Contains third-party content. Not financial advice.
See Terms and Conditions.
⏰ Time: 2025/8/5 21:00:00 - 2025/8/11 23:59:59(UTC)
✅ Activity 1: Register and complete the trading tasks below to receive one share of the airdrop.
✅ Activity 2: Trade ahead and get 5 USDT airdrop
✅ Activity 3: Sunshine Award, register and get 10 USDT equivalent tokens
🔸 More details:https://bit.ly/453FTc5


JuCoin Community
2025-08-05 15:25
💙Airdrop Tuesday: Register to receive airdrops and trade for 10,000 USDT 🎉
Disclaimer:Contains third-party content. Not financial advice.
See Terms and Conditions.
🔹Deposit/Withdrawal Time: August 10, 2025, 01:50 (UTC)
🔹Trading Time: August 11, 2025, 01:50 (UTC)
🪧More:https://bit.ly/3UeEBF0
JuCoin Community
2025-08-05 02:44
JuCoin to List D3XAI/USDT Trading Pair on August 11, 2025
Disclaimer:Contains third-party content. Not financial advice.
See Terms and Conditions.
Bitcoin Profit — every bull run cycle hits the same 😅 "This is my last year broke..." Meanwhile the house is collapsing behind you 🫠 Hopium never dies, even when profits do 🙃
Check out our YouTube Channel 👉
#BullRunCycle #BitcoinProfit #HopiumLives

JuCoin Media
2025-08-01 11:13
Hoping for That Bitcoin Profit Every Bull Run Cycle 📈
Disclaimer:Contains third-party content. Not financial advice.
See Terms and Conditions.
The DeFi sector is experiencing a remarkable resurgence in 2025, transforming from speculative arena to robust financial infrastructure. Here's what's driving this explosive growth:
💰 Key Growth Drivers:
-
Layer 2 solutions (Optimism, Arbitrum, zk-Rollups) slashing costs & boosting speeds by 20%
$153 billion TVL reached in July 2025 - a three-year high!
Major institutional investment with $1.69B+ Ethereum holdings from leading firms
Enhanced regulatory clarity through EU's MiCA framework
🎯 What's Powering the Momentum:
1️⃣ Cross-Chain Revolution: Seamless asset transfers across Ethereum, Solana, Avalanche ecosystems 2️⃣ Yield Farming Evolution: Advanced protocols offering up to 25% returns on stablecoin strategies 3️⃣ Solana DEX Dominance: 81% of all DEX transactions, $890B trading volume in 5 months 4️⃣ Real-World Asset Tokenization: Converting real estate, commodities into tradeable blockchain tokens
🏆 Innovation Highlights:
-
Jupiter Perps averaging $1B daily perpetual trading volume
AI-powered security with real-time risk alerts and scam detection
Decentralized stablecoins driving cross-chain liquidity
Enhanced composability creating "money legos" for complex financial products
💡 Market Impact:
-
Ethereum maintains 60% DeFi TVL dominance with Lido & Aave leading
Solana surpassing Ethereum in transaction volumes and daily active users
Liquid restaking protocols attracting massive institutional inflows
Multi-signature wallets & advanced auditing boosting security confidence
🔮 Future Outlook: The shift from speculation to utility-focused infrastructure signals DeFi's maturation. With improved security, regulatory clarity, and institutional adoption, the sector is positioned for mainstream financial integration.
Read the complete analysis with detailed insights and market projections: 👇
https://blog.jucoin.com/explore-the-catalysts-behind-defis-recent-surge/?utm_source=blog
#DeFi #Layer2 #Ethereum #Solana #YieldFarming #Crypto #Blockchain #TVL #Institutions #RWA #CrossChain #JuCoin #Web3 #TradFi #Stablecoins #DEX #AI #Security


JU Blog
2025-08-01 08:54
🚀 DeFi Hits $153B TVL - Exploring the Key Catalysts Behind 2025's Massive Surge!
Disclaimer:Contains third-party content. Not financial advice.
See Terms and Conditions.
Grayscale launched the Story Trust on July 31, 2025, providing qualified investors daily access to Story protocol's native token $IP. Story aims to build an $80 trillion global IP economy infrastructure by minting music, media, and real-world data into programmable, traceable on-chain assets.
💰 What's New:
-
Daily subscription windows for Rule 501(a) accredited investors
2% annual management fee, no redemption fees
Closed-end trust structure with 1:1 share-to-asset backing
Over 1.7M IP transactions and 200K+ monthly active users on Story blockchain
🎯 Trust Structure: 1️⃣ Single-asset trust dedicated to $IP holdings 2️⃣ NAV-based share pricing for fair issuance 3️⃣ No private key custody required for investors 4️⃣ Regulated under U.S. securities laws for compliance
🏆 Key Features:
-
Accredited Investors Only: HNW individuals, licensed professionals, and $5M+ entities
Management Fee: 2% annually covering operations, auditing, and compliance
Liquidity: No redemption service - long-term holding expected
Secondary Markets: Pursuing OTC listing and SEC approval
⚠️ Risk Considerations:
-
Premium/discount volatility without redemption options
Potential illiquidity until secondary market approval
Story protocol execution risks as early-stage project
No guaranteed secondary market listing
🔮 Future Outlook: Story protocol expanding into art, media rights, AI data licensing, and digital likeness management. As ecosystem grows with increased transaction volume and innovation, underlying $IP value may appreciate, providing stable long-term exposure for institutional portfolios.
💡 Quick FAQ:
-
Who can invest? Rule 501(a) accredited investors only
When can shares trade? Awaiting OTC listing and SEC approval
Use cases? Music/media rights, AI training data, digital assets management
Fee structure? 2% annual management fee, competitive vs OTC alternatives
Institutional investors are already planning to add $IP exposure to their digital asset portfolios through this compliant trust structure!
Read the complete in-depth analysis with risk mitigation strategies: 👇
https://blog.jucoin.com/grayscale-story-trust-analysis/?utm_source=blog
#Grayscale #StoryTrust #IP #IntellectualProperty #AccreditedInvestors #DigitalAssets #Blockchain #Compliance #InstitutionalCrypto #JuCoin #NAV #SEC #OTC #Web3 #TokenTrust

JU Blog
2025-08-01 08:47
🚀 Grayscale Story Trust is LIVE - Daily $IP Subscriptions Now Open!
Disclaimer:Contains third-party content. Not financial advice.
See Terms and Conditions.
StableCoinX Inc. completed a SPAC merger with TLGY Acquisition Corp, becoming the first stablecoin-focused treasury company set to trade on Nasdaq under ticker "USDE" in Q4 2025. Here's what makes this groundbreaking:
💰 Deal Highlights:
-
$360M total funding through SPAC merger
$60M from Ethena Foundation + $300M from institutional investors
Major backers: Dragonfly Capital, Galaxy Digital, Pantera Capital, Haun Ventures
Single focus: Accumulating and permanently holding ENA tokens
📈 Massive ENA Buyback Program:
-
$260M deployed for systematic ENA token purchases
$5M daily buying pressure over 6 weeks
Targeting ~8% of ENA's circulating supply
All purchased tokens held permanently - never sold!
🎯 Business Model:
-
Operating as treasury vehicle for Ethena ecosystem (3rd largest stablecoin issuer)
Running validator infrastructure for USDe protocol
Using 100% of earnings exclusively for more ENA accumulation
Ethena Foundation has veto power over any token sales
💡 Market Impact:
-
ENA price jumped 8-11% within 24 hours of announcement
Current trading: $0.57-$0.58 with $900M+ daily volume
Creates first regulated equity vehicle for stablecoin exposure
Similar to MicroStrategy's Bitcoin strategy but for stablecoins
🏆 Key Advantages:
-
SEC-registered entity with standard equity oversight
Institutional access through familiar investment vehicle
Partnership with BlackRock's BUIDL tokenized fund
Permanent capital with no selling pressure
⚠️ Risk Considerations:
-
High concentration risk tied to ENA token performance
Token volatility typical of governance assets
Success depends on Ethena protocol growth and stablecoin market expansion
Regulatory changes could impact synthetic dollar operations
🔮 Timeline:
-
Buyback Program: Started immediately (July 2025)
Nasdaq Listing: Expected Q4 2025
Ticker Symbol: "USDE"
This innovative model bridges traditional finance with DeFi, offering regulated exposure to the rapidly growing synthetic dollar ecosystem. With Ethena's USDe being the 3rd largest stablecoin globally, early positioning could provide significant returns as the market matures.
Read the complete analysis with detailed risk assessment and strategic insights: 👇
https://blog.jucoin.com/stablecoinx-usde-nasdaq-analysis/
#StableCoinX #USDE #ENA #Ethena #Nasdaq #SPAC #Stablecoin #DeFi #Treasury #Crypto #Blockchain #TradFi #Buyback #JuCoin #Investment #DigitalDollar #USDe #Regulation #Institutional

JU Blog
2025-07-31 13:29
🚀 StableCoinX Secured $360M SPAC Merger - First Stablecoin Treasury Company to Trade on Nasdaq!
Disclaimer:Contains third-party content. Not financial advice.
See Terms and Conditions.
📣Announcement on Suspension of POL Deposit and Withdrawal Services
Due to POL network maintenance, we will suspend POL deposit and withdrawal services and carry out maintenance. The recovery time will be notified separately depending on the stability of the network. Please pay attention to the official announcement.
We apologize for any inconvenience caused and thank you for your understanding and support. If you have any questions, please contact our online customer service or consult through official channels.
👉 More Detail https://support.jucoin.blog/hc/en-001/articles/49351448654233?utm_campaign=POL0730&utm_source=telegram&utm_medium=post


JuCoin Official
2025-07-31 09:12
📣Announcement on Suspension of POL Deposit and Withdrawal Services
Disclaimer:Contains third-party content. Not financial advice.
See Terms and Conditions.
🐣 New to Crypto? Start Here!
🔸 1-min to know what #FUD is → https://youtube.com/shorts/i6s2QQ9XEDw?feature=share
📌 Bookmark this thread – your ultimate starter kit👇
#CryptoBeginner #Blockchain101 #LearnWeb3

JuCoin Official
2025-07-31 09:12
🐣 New to Crypto? Start Here!
Disclaimer:Contains third-party content. Not financial advice.
See Terms and Conditions.
📢New Listing @Schili_official
JuCoin will list the SCHILI/USDT trading pair on Aug. 1, 2025
🔷Deposit & Withdrawal: 9:00 (UTC) on July 31, 2025
🔷Trading: 15:00 (UTC) on Aug. 1, 2025
👉More: https://support.jucoin.blog/hc/en-001/articles/49339467955993?utm_camhttps://support.jucoin.blog/hc/en-001/articles/49371776526489?utm_campaign=listing_SCHILI&utm_source=twitter&utm_medium=post
#JuCoin #SCHILI

JuCoin Official
2025-07-31 09:10
📢New Listing @Schili_official
Disclaimer:Contains third-party content. Not financial advice.
See Terms and Conditions.
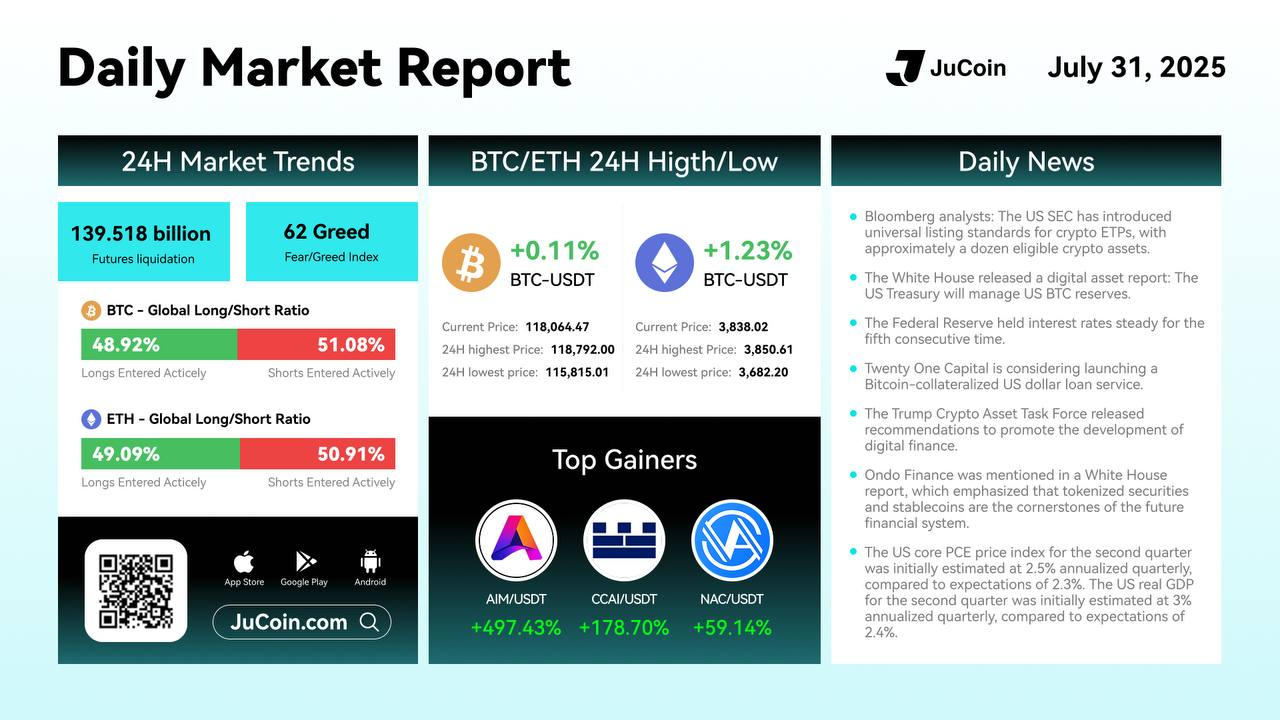
📅 July 31 2025
🎉 Stay updated with the latest crypto market trends!
👉 Trade on:https://bit.ly/3DFYq30
👉 X:https://twitter.com/Jucoinex
👉 APP download: https://www.jucoin.com/en/community-downloads
JuCoin Community
2025-07-31 06:30
🚀 #JuCoin Daily Market Report
Disclaimer:Contains third-party content. Not financial advice.
See Terms and Conditions.
🔍About XYC:
XYC is a decentralized mall protocol deployed on the JuChain public chain. Its core is to build a new mall ecosystem based on blockchain technology and supported by a trusted global location data network. It is committed to weaving a trusted global location data network.
👉 More Detail:https://support.jucoin.blog/hc/en-001/articles/49300101768473?utm_campaign=ann_XYC&utm_source=telegram&utm_medium=post
JuCoin Community
2025-07-31 06:27
📣XYC officially join the JuCoin ecosystem
Disclaimer:Contains third-party content. Not financial advice.
See Terms and Conditions.
What Security Measures Are in Place for OKX Pay?
Overview of OKX Pay Security Protocols
OKX Pay, developed by the well-established cryptocurrency exchange OKX, aims to provide a secure and user-friendly payment platform. As digital payments become increasingly prevalent, ensuring robust security measures is vital to protect users’ funds and personal data. The platform employs multiple layers of security protocols aligned with industry best practices, including encryption, cold storage solutions, and regulatory compliance.
One of the core features is Two-Factor Authentication (2FA). This adds an extra verification step during login or high-risk transactions, significantly reducing the risk of unauthorized access even if passwords are compromised. Encryption also plays a crucial role; all transactions on OKX Pay are secured using advanced cryptographic techniques that safeguard data from interception or tampering during transmission.
Funds deposited into OKX Pay are stored primarily in cold storage wallets—offline wallets that are disconnected from the internet. Cold storage minimizes exposure to hacking attempts since most cyberattacks target online wallets connected directly to networks. Additionally, the platform adheres strictly to KYC (Know Your Customer) and AML (Anti-Money Laundering) regulations worldwide. These compliance measures involve verifying user identities through rigorous processes before allowing access to certain features or higher transaction limits.
Regular security audits form another pillar of OKX’s approach. The company collaborates with reputable cybersecurity firms for periodic assessments aimed at identifying vulnerabilities and implementing necessary patches promptly. Furthermore, insurance coverage is provided for user funds held on the platform—adding an extra layer of reassurance against potential losses due to breaches or hacking incidents.
Recent Enhancements in Security Features
In recent months, OKX has taken steps toward strengthening its security infrastructure further by introducing biometric authentication options for high-value transactions. This biometric layer—using fingerprint scans or facial recognition—serves as an additional verification step that enhances account protection without compromising convenience.
The exchange has also formed strategic partnerships with leading cybersecurity firms dedicated to conducting comprehensive security assessments and adopting industry-leading practices in cybersecurity management. These collaborations help ensure that any emerging threats are swiftly identified and mitigated before they can impact users.
Furthermore, aligning with evolving regulatory standards across different jurisdictions demonstrates OKX’s commitment toward transparency and legal compliance—a critical aspect contributing positively to overall trustworthiness within the crypto community.
User Education & Awareness Initiatives
Security isn’t solely about technological safeguards; informed users play a vital role in maintaining safety standards as well. Recognizing this fact, OKX has launched educational campaigns aimed at raising awareness about common threats like phishing scams and social engineering tactics targeting cryptocurrency holders.
These initiatives include tips on creating strong passwords, avoiding suspicious links or emails claiming account issues unexpectedly—and recognizing signs of potential scams designed to steal login credentials or seed phrases. Educating users helps foster a culture where individuals actively participate in safeguarding their accounts alongside technical protections implemented by the platform itself.
Potential Risks Despite Robust Security Measures
While OKX invests heavily in securing its payment system through layered defenses—including encryption protocols, cold storage solutions—and ongoing audits no system can be entirely immune from threats. Cybercriminals continuously evolve their tactics; phishing remains one of the most common attack vectors targeting unsuspecting users who may inadvertently disclose sensitive information via malicious links or fake websites posing as legitimate platforms like OKX Pay.
Regulatory changes also pose challenges: new laws could require modifications in how user data is handled or introduce additional compliance obligations that might temporarily affect service operations until fully integrated into existing systems.
Moreover, any significant breach involving user data could undermine trust—not only affecting individual accounts but potentially damaging overall reputation among current and prospective customers alike—a crucial consideration given fierce competition within crypto payment services market segments where perceived security often influences choice heavily.
Staying Ahead: Continuous Improvements & Vigilance
To maintain its competitive edge while safeguarding assets effectively:
- Regular updates: Implementing timely patches based on vulnerability assessments.
- Enhanced authentication methods: Expanding biometric options.
- Partnerships with cybersecurity experts: Conducting thorough penetration testing.
- User education programs: Promoting best practices among clients.
This proactive approach ensures that despite evolving cyber threats and regulatory landscapes worldwide — which require constant adaptation —OKX remains committed towards providing a secure environment for digital payments.
How Does User Trust Influence Payment System Security?
Trust forms a cornerstone when it comes to financial platforms like OKX Pay because users need confidence that their assets are protected against theft or misuse. Transparent communication about ongoing security efforts—including regular audits—and visible insurance coverage reassure customers about safety levels offered by such platforms.
Additionally, fostering an educated user base capable of recognizing potential scams reduces human error-related vulnerabilities significantly—a key factor considering many breaches originate from social engineering rather than technical flaws alone.
Final Thoughts
OKX Pay's layered approach combines technological safeguards such as encryption technology—with physical measures like cold storage—and procedural elements including KYC/AML compliance—to create a comprehensive defense system against cyber threats while promoting transparency through regular audits and partnerships with top-tier cybersecurity firms.. While no system guarantees absolute immunity from attacks given ever-changing threat landscapes—the continuous investment into enhanced features coupled with active user education positions it favorably within competitive crypto payment ecosystems aiming for long-term trustworthiness

Lo
2025-06-11 16:27
What security measures are in place for OKX Pay?
What Security Measures Are in Place for OKX Pay?
Overview of OKX Pay Security Protocols
OKX Pay, developed by the well-established cryptocurrency exchange OKX, aims to provide a secure and user-friendly payment platform. As digital payments become increasingly prevalent, ensuring robust security measures is vital to protect users’ funds and personal data. The platform employs multiple layers of security protocols aligned with industry best practices, including encryption, cold storage solutions, and regulatory compliance.
One of the core features is Two-Factor Authentication (2FA). This adds an extra verification step during login or high-risk transactions, significantly reducing the risk of unauthorized access even if passwords are compromised. Encryption also plays a crucial role; all transactions on OKX Pay are secured using advanced cryptographic techniques that safeguard data from interception or tampering during transmission.
Funds deposited into OKX Pay are stored primarily in cold storage wallets—offline wallets that are disconnected from the internet. Cold storage minimizes exposure to hacking attempts since most cyberattacks target online wallets connected directly to networks. Additionally, the platform adheres strictly to KYC (Know Your Customer) and AML (Anti-Money Laundering) regulations worldwide. These compliance measures involve verifying user identities through rigorous processes before allowing access to certain features or higher transaction limits.
Regular security audits form another pillar of OKX’s approach. The company collaborates with reputable cybersecurity firms for periodic assessments aimed at identifying vulnerabilities and implementing necessary patches promptly. Furthermore, insurance coverage is provided for user funds held on the platform—adding an extra layer of reassurance against potential losses due to breaches or hacking incidents.
Recent Enhancements in Security Features
In recent months, OKX has taken steps toward strengthening its security infrastructure further by introducing biometric authentication options for high-value transactions. This biometric layer—using fingerprint scans or facial recognition—serves as an additional verification step that enhances account protection without compromising convenience.
The exchange has also formed strategic partnerships with leading cybersecurity firms dedicated to conducting comprehensive security assessments and adopting industry-leading practices in cybersecurity management. These collaborations help ensure that any emerging threats are swiftly identified and mitigated before they can impact users.
Furthermore, aligning with evolving regulatory standards across different jurisdictions demonstrates OKX’s commitment toward transparency and legal compliance—a critical aspect contributing positively to overall trustworthiness within the crypto community.
User Education & Awareness Initiatives
Security isn’t solely about technological safeguards; informed users play a vital role in maintaining safety standards as well. Recognizing this fact, OKX has launched educational campaigns aimed at raising awareness about common threats like phishing scams and social engineering tactics targeting cryptocurrency holders.
These initiatives include tips on creating strong passwords, avoiding suspicious links or emails claiming account issues unexpectedly—and recognizing signs of potential scams designed to steal login credentials or seed phrases. Educating users helps foster a culture where individuals actively participate in safeguarding their accounts alongside technical protections implemented by the platform itself.
Potential Risks Despite Robust Security Measures
While OKX invests heavily in securing its payment system through layered defenses—including encryption protocols, cold storage solutions—and ongoing audits no system can be entirely immune from threats. Cybercriminals continuously evolve their tactics; phishing remains one of the most common attack vectors targeting unsuspecting users who may inadvertently disclose sensitive information via malicious links or fake websites posing as legitimate platforms like OKX Pay.
Regulatory changes also pose challenges: new laws could require modifications in how user data is handled or introduce additional compliance obligations that might temporarily affect service operations until fully integrated into existing systems.
Moreover, any significant breach involving user data could undermine trust—not only affecting individual accounts but potentially damaging overall reputation among current and prospective customers alike—a crucial consideration given fierce competition within crypto payment services market segments where perceived security often influences choice heavily.
Staying Ahead: Continuous Improvements & Vigilance
To maintain its competitive edge while safeguarding assets effectively:
- Regular updates: Implementing timely patches based on vulnerability assessments.
- Enhanced authentication methods: Expanding biometric options.
- Partnerships with cybersecurity experts: Conducting thorough penetration testing.
- User education programs: Promoting best practices among clients.
This proactive approach ensures that despite evolving cyber threats and regulatory landscapes worldwide — which require constant adaptation —OKX remains committed towards providing a secure environment for digital payments.
How Does User Trust Influence Payment System Security?
Trust forms a cornerstone when it comes to financial platforms like OKX Pay because users need confidence that their assets are protected against theft or misuse. Transparent communication about ongoing security efforts—including regular audits—and visible insurance coverage reassure customers about safety levels offered by such platforms.
Additionally, fostering an educated user base capable of recognizing potential scams reduces human error-related vulnerabilities significantly—a key factor considering many breaches originate from social engineering rather than technical flaws alone.
Final Thoughts
OKX Pay's layered approach combines technological safeguards such as encryption technology—with physical measures like cold storage—and procedural elements including KYC/AML compliance—to create a comprehensive defense system against cyber threats while promoting transparency through regular audits and partnerships with top-tier cybersecurity firms.. While no system guarantees absolute immunity from attacks given ever-changing threat landscapes—the continuous investment into enhanced features coupled with active user education positions it favorably within competitive crypto payment ecosystems aiming for long-term trustworthiness
Disclaimer:Contains third-party content. Not financial advice.
See Terms and Conditions.
Resources for Understanding Credit Spreads: A Complete Guide
Understanding credit spreads is essential for investors, financial analysts, and anyone interested in the bond markets. These spreads serve as a key indicator of market risk perception and economic health. To deepen your knowledge, it’s important to explore various resources that provide reliable information, analytical tools, and expert insights. This article outlines the most valuable resources available for understanding credit spreads comprehensively.
Financial News Websites and Market Data Platforms
One of the most accessible ways to stay informed about credit spreads is through reputable financial news outlets such as Bloomberg, Reuters, CNBC, and Financial Times. These platforms offer real-time data on bond yields across different sectors and maturities. They also publish analysis articles that interpret market movements related to credit spreads—helping you understand current trends influenced by economic conditions or geopolitical events.
Market data platforms like Investing.com or MarketWatch provide detailed charts showing historical credit spread movements over time. These visual tools help identify patterns during periods of volatility or stability in the markets.
Government Agencies and Central Bank Reports
Government agencies such as the U.S. Federal Reserve or European Central Bank publish reports on monetary policy decisions that directly impact interest rates and consequently influence credit spreads. Their publications often include economic outlooks which can help you gauge potential shifts in risk premiums demanded by investors.
Additionally, central banks release statistical data on bond yields and default rates—valuable metrics when analyzing how macroeconomic factors affect creditworthiness perceptions across different sectors.
Credit Rating Agencies’ Publications
Major rating agencies like Moody’s Investors Service, Standard & Poor’s (S&P), Fitch Ratings provide detailed reports explaining their ratings criteria for various issuers. Understanding these ratings helps contextualize why certain bonds have wider or narrower spreads at any given time.
Their research papers often delve into sector-specific risks or highlight emerging trends affecting default probabilities—offering insights into how changes in issuer ratings can influence market perceptions of risk premiums.
Academic Journals & Industry Reports
For a more scholarly approach to understanding credit spreads, academic journals such as The Journal of Fixed Income or The Journal of Finance publish peer-reviewed studies exploring theoretical models behind spread dynamics. These articles analyze factors like liquidity risk, macroeconomic variables, investor behavior patterns—and are invaluable for those seeking a deeper technical understanding.
Industry reports from consulting firms like McKinsey & Company or Deloitte also examine broader market trends impacting credit markets globally—including regulatory changes that could tighten lending standards affecting spread levels.
Specialized Financial Tools & Analytical Software
Advanced investors often utilize specialized software solutions designed specifically to analyze bond markets comprehensively:
- Bloomberg Terminal: Offers extensive datasets on bond yields worldwide along with analytical tools for assessing spread movements.
- FactSet: Provides customizable dashboards tracking sector-specific credits.
- S&P Capital IQ: Delivers detailed issuer profiles alongside historical spread data.
These tools enable users to perform scenario analysis under different economic assumptions—enhancing decision-making accuracy based on real-time analytics.
Educational Resources & Online Courses
To build foundational knowledge about credit spreads from scratch—or deepen existing expertise—consider enrolling in online courses offered by institutions like Coursera or edX focusing on fixed income securities and financial markets fundamentals. Many universities also offer free webinars covering topics such as yield curves, default risk assessment methods—and how these relate directly to understanding credit spread behaviors over time.
Books authored by industry experts are another excellent resource; titles like “Fixed Income Securities” by Bruce Tuckman provide comprehensive explanations suitable for both beginners and seasoned professionals aiming to refine their grasp of complex concepts involved with yield differentials among bonds with similar ratings but varying maturities.
Why Reliable Resources Matter When Analyzing Credit Spreads
Using credible sources ensures your analysis is grounded in accurate information rather than speculation—which is crucial given how sensitive bond prices are to shifts in perceived risks driven by macroeconomic developments or geopolitical uncertainties. Combining insights from multiple authoritative channels enhances your ability to interpret market signals effectively while maintaining an informed perspective aligned with current realities.
Staying Updated With Market Trends And Risk Factors
Regularly consulting diverse resources allows investors not only track immediate changes but also anticipate future movements based on evolving economic indicators such as inflation rates or fiscal policy adjustments—all vital components influencing whether credit spreads widen during downturns—or narrow when confidence returns amid positive growth prospects.
Incorporating Expert Analysis Into Your Strategy
Expert opinions found through analyst reports or industry commentary add context beyond raw data points—they explain underlying causes behind sudden widening/spread compression events which might otherwise seem perplexing at first glance.
By leveraging these varied resources—from real-time news feeds through academic research—you develop a well-rounded understanding necessary for making informed investment decisions regarding bonds' relative value versus perceived risks.
Key Takeaways:
- Reputable financial news websites offer timely updates relevant to current market conditions affecting credit spreads.
- Government publications provide macroeconomic context crucial for interpreting overall trend directions.
- Credit rating agencies’ analyses help assess issuer-specific risks influencing yield differences.
- Advanced analytical software enables scenario testing under various economic assumptions.
- Educational materials support building foundational knowledge essential for effective analysis.
Investors who utilize these comprehensive resources will be better equipped not only to understand what influences credit spreads but also how they can incorporate this knowledge into strategic asset allocation plans aimed at optimizing returns while managing risks effectively within dynamic financial environments.
Keywords: Credit Spreads Resources | Bond Market Analysis | Fixed Income Education | Yield Curve Insights | Default Risk Assessment
kai
2025-06-09 22:38
What resources are available for understanding credit spreads?
Resources for Understanding Credit Spreads: A Complete Guide
Understanding credit spreads is essential for investors, financial analysts, and anyone interested in the bond markets. These spreads serve as a key indicator of market risk perception and economic health. To deepen your knowledge, it’s important to explore various resources that provide reliable information, analytical tools, and expert insights. This article outlines the most valuable resources available for understanding credit spreads comprehensively.
Financial News Websites and Market Data Platforms
One of the most accessible ways to stay informed about credit spreads is through reputable financial news outlets such as Bloomberg, Reuters, CNBC, and Financial Times. These platforms offer real-time data on bond yields across different sectors and maturities. They also publish analysis articles that interpret market movements related to credit spreads—helping you understand current trends influenced by economic conditions or geopolitical events.
Market data platforms like Investing.com or MarketWatch provide detailed charts showing historical credit spread movements over time. These visual tools help identify patterns during periods of volatility or stability in the markets.
Government Agencies and Central Bank Reports
Government agencies such as the U.S. Federal Reserve or European Central Bank publish reports on monetary policy decisions that directly impact interest rates and consequently influence credit spreads. Their publications often include economic outlooks which can help you gauge potential shifts in risk premiums demanded by investors.
Additionally, central banks release statistical data on bond yields and default rates—valuable metrics when analyzing how macroeconomic factors affect creditworthiness perceptions across different sectors.
Credit Rating Agencies’ Publications
Major rating agencies like Moody’s Investors Service, Standard & Poor’s (S&P), Fitch Ratings provide detailed reports explaining their ratings criteria for various issuers. Understanding these ratings helps contextualize why certain bonds have wider or narrower spreads at any given time.
Their research papers often delve into sector-specific risks or highlight emerging trends affecting default probabilities—offering insights into how changes in issuer ratings can influence market perceptions of risk premiums.
Academic Journals & Industry Reports
For a more scholarly approach to understanding credit spreads, academic journals such as The Journal of Fixed Income or The Journal of Finance publish peer-reviewed studies exploring theoretical models behind spread dynamics. These articles analyze factors like liquidity risk, macroeconomic variables, investor behavior patterns—and are invaluable for those seeking a deeper technical understanding.
Industry reports from consulting firms like McKinsey & Company or Deloitte also examine broader market trends impacting credit markets globally—including regulatory changes that could tighten lending standards affecting spread levels.
Specialized Financial Tools & Analytical Software
Advanced investors often utilize specialized software solutions designed specifically to analyze bond markets comprehensively:
- Bloomberg Terminal: Offers extensive datasets on bond yields worldwide along with analytical tools for assessing spread movements.
- FactSet: Provides customizable dashboards tracking sector-specific credits.
- S&P Capital IQ: Delivers detailed issuer profiles alongside historical spread data.
These tools enable users to perform scenario analysis under different economic assumptions—enhancing decision-making accuracy based on real-time analytics.
Educational Resources & Online Courses
To build foundational knowledge about credit spreads from scratch—or deepen existing expertise—consider enrolling in online courses offered by institutions like Coursera or edX focusing on fixed income securities and financial markets fundamentals. Many universities also offer free webinars covering topics such as yield curves, default risk assessment methods—and how these relate directly to understanding credit spread behaviors over time.
Books authored by industry experts are another excellent resource; titles like “Fixed Income Securities” by Bruce Tuckman provide comprehensive explanations suitable for both beginners and seasoned professionals aiming to refine their grasp of complex concepts involved with yield differentials among bonds with similar ratings but varying maturities.
Why Reliable Resources Matter When Analyzing Credit Spreads
Using credible sources ensures your analysis is grounded in accurate information rather than speculation—which is crucial given how sensitive bond prices are to shifts in perceived risks driven by macroeconomic developments or geopolitical uncertainties. Combining insights from multiple authoritative channels enhances your ability to interpret market signals effectively while maintaining an informed perspective aligned with current realities.
Staying Updated With Market Trends And Risk Factors
Regularly consulting diverse resources allows investors not only track immediate changes but also anticipate future movements based on evolving economic indicators such as inflation rates or fiscal policy adjustments—all vital components influencing whether credit spreads widen during downturns—or narrow when confidence returns amid positive growth prospects.
Incorporating Expert Analysis Into Your Strategy
Expert opinions found through analyst reports or industry commentary add context beyond raw data points—they explain underlying causes behind sudden widening/spread compression events which might otherwise seem perplexing at first glance.
By leveraging these varied resources—from real-time news feeds through academic research—you develop a well-rounded understanding necessary for making informed investment decisions regarding bonds' relative value versus perceived risks.
Key Takeaways:
- Reputable financial news websites offer timely updates relevant to current market conditions affecting credit spreads.
- Government publications provide macroeconomic context crucial for interpreting overall trend directions.
- Credit rating agencies’ analyses help assess issuer-specific risks influencing yield differences.
- Advanced analytical software enables scenario testing under various economic assumptions.
- Educational materials support building foundational knowledge essential for effective analysis.
Investors who utilize these comprehensive resources will be better equipped not only to understand what influences credit spreads but also how they can incorporate this knowledge into strategic asset allocation plans aimed at optimizing returns while managing risks effectively within dynamic financial environments.
Keywords: Credit Spreads Resources | Bond Market Analysis | Fixed Income Education | Yield Curve Insights | Default Risk Assessment
Disclaimer:Contains third-party content. Not financial advice.
See Terms and Conditions.
Are There Specific Tools for Trading Credit Spreads?
Trading credit spreads requires a combination of analytical tools, market data, and trading platforms to effectively assess risk and identify profitable opportunities. These tools help traders interpret market signals, compare bond yields, and execute trades with confidence. Understanding the available resources is essential for both novice and experienced traders aiming to navigate the complexities of credit spread trading.
Key Market Indices and Benchmarks
One of the foundational tools in credit spreads trading is the use of indices that serve as benchmarks for assessing market performance. The Barclays Capital U.S. Corporate High Yield Index tracks the performance of high-yield bonds (junk bonds), while the Barclays Capital U.S. Credit Index measures investment-grade corporate bonds. These indices provide a broad view of how different segments are performing relative to each other, enabling traders to gauge whether credit spreads are widening or narrowing in response to economic conditions.
By comparing current bond yields against these benchmarks, traders can identify potential entry or exit points based on perceived over- or under-valued spreads. For example, an unusually wide spread might signal increased default risk or market stress, presenting a buying opportunity if fundamentals support it.
Bond Yield Curves as Analytical Tools
Yield curves are vital for visualizing how bond yields vary across different maturities within similar credit categories. They illustrate expectations about future interest rates and inflation trends—factors that influence credit spreads significantly.
A normal upward-sloping yield curve suggests healthy economic growth with manageable risk premiums; conversely, an inverted curve may indicate recession fears and wider spreads on risky assets like high-yield bonds. Traders analyze shifts in these curves over time to anticipate changes in credit risk sentiment before they fully materialize in spread movements.
Role of Credit Rating Agencies
Credit rating agencies such as Moody’s, S&P Global Ratings, and Fitch Ratings play a crucial role by providing independent assessments of issuer creditworthiness. Their ratings influence investor perceptions—and consequently—yield differences between various bonds.
When an agency downgrades a company's rating from investment grade to junk status—or vice versa—the associated bond's yield typically adjusts accordingly due to changing perceived risks. Traders monitor these ratings closely since sudden downgrades can cause rapid widening in credit spreads; thus making them key indicators when planning trades.
Financial News Platforms & Market Data Providers
Real-time information is indispensable when trading credit spreads because markets can shift quickly amid macroeconomic news or geopolitical events. Platforms like Bloomberg Terminal and Reuters Eikon offer comprehensive data feeds—including live bond prices, yield movements, news alerts—and analytical tools tailored specifically for fixed-income markets.
These platforms also provide access to historical data trends which help traders analyze patterns over time—crucial for developing effective strategies around spread movements during volatile periods or economic cycles.
Advanced Trading Software & Platforms
Modern trading software enhances decision-making by integrating multiple data sources into user-friendly interfaces that facilitate trade execution directly from analysis screens:
- Bloomberg Terminal: Offers extensive analytics on bond markets alongside customizable dashboards.
- Reuters Eikon: Provides real-time quotes combined with news updates relevant for fixed-income securities.
- Proprietary Trading Platforms: Many financial institutions develop their own systems optimized for specific strategies such as pair trades involving different segments within the debt market.
These platforms often include features like scenario analysis (stress testing), automated alerts based on preset criteria (e.g., spread thresholds), and order execution capabilities—all critical components when managing complex options around credit spread fluctuations efficiently.
Emerging Technologies Impacting Credit Spread Trading
Recent technological advancements have further empowered traders through machine learning algorithms capable of analyzing vast datasets faster than traditional methods—identifying subtle patterns indicating potential shifts in spread dynamics before they become apparent publicly.
Artificial intelligence-driven models now assist with predictive analytics regarding default probabilities or macroeconomic impacts influencing sector-specific risks—a significant advantage given how swiftly sentiment can change during periods of heightened volatility such as during global crises or regulatory shifts.
Summary: Essential Tools Every Trader Should Know
To succeed at trading credit spreads effectively:
- Use benchmark indices like Barclays High Yield Index & Investment Grade Index
- Analyze yield curves regularly
- Monitor updates from reputable rating agencies
- Leverage real-time financial news platforms
- Utilize advanced software solutions tailored for fixed-income analysis
- Keep abreast with emerging AI-driven analytics technologies
Combining these resources allows traders not only to interpret current market conditions but also anticipate future movements—an essential skill given how sensitive this segment is to macroeconomic factors ranging from central bank policies to geopolitical tensions.
Final Thoughts on Building Expertise in Credit Spread Trading Tools
Developing proficiency with these tools enhances your ability to make informed decisions rooted in sound analysis rather than speculation alone. As markets evolve—with increasing automation and sophisticated data modeling—the importance lies not just in having access but understanding how best leverage each resource within your overall strategy framework.
By integrating index benchmarks, yield curve insights, ratings assessments, real-time news feeds—and embracing innovative tech solutions—you position yourself better equipped against unpredictable swings inherent within fixed-income markets’ complex landscape.
Stay informed. Stay prepared. Trade smarter.
JCUSER-F1IIaxXA
2025-06-09 22:35
Are there specific tools for trading credit spreads?
Are There Specific Tools for Trading Credit Spreads?
Trading credit spreads requires a combination of analytical tools, market data, and trading platforms to effectively assess risk and identify profitable opportunities. These tools help traders interpret market signals, compare bond yields, and execute trades with confidence. Understanding the available resources is essential for both novice and experienced traders aiming to navigate the complexities of credit spread trading.
Key Market Indices and Benchmarks
One of the foundational tools in credit spreads trading is the use of indices that serve as benchmarks for assessing market performance. The Barclays Capital U.S. Corporate High Yield Index tracks the performance of high-yield bonds (junk bonds), while the Barclays Capital U.S. Credit Index measures investment-grade corporate bonds. These indices provide a broad view of how different segments are performing relative to each other, enabling traders to gauge whether credit spreads are widening or narrowing in response to economic conditions.
By comparing current bond yields against these benchmarks, traders can identify potential entry or exit points based on perceived over- or under-valued spreads. For example, an unusually wide spread might signal increased default risk or market stress, presenting a buying opportunity if fundamentals support it.
Bond Yield Curves as Analytical Tools
Yield curves are vital for visualizing how bond yields vary across different maturities within similar credit categories. They illustrate expectations about future interest rates and inflation trends—factors that influence credit spreads significantly.
A normal upward-sloping yield curve suggests healthy economic growth with manageable risk premiums; conversely, an inverted curve may indicate recession fears and wider spreads on risky assets like high-yield bonds. Traders analyze shifts in these curves over time to anticipate changes in credit risk sentiment before they fully materialize in spread movements.
Role of Credit Rating Agencies
Credit rating agencies such as Moody’s, S&P Global Ratings, and Fitch Ratings play a crucial role by providing independent assessments of issuer creditworthiness. Their ratings influence investor perceptions—and consequently—yield differences between various bonds.
When an agency downgrades a company's rating from investment grade to junk status—or vice versa—the associated bond's yield typically adjusts accordingly due to changing perceived risks. Traders monitor these ratings closely since sudden downgrades can cause rapid widening in credit spreads; thus making them key indicators when planning trades.
Financial News Platforms & Market Data Providers
Real-time information is indispensable when trading credit spreads because markets can shift quickly amid macroeconomic news or geopolitical events. Platforms like Bloomberg Terminal and Reuters Eikon offer comprehensive data feeds—including live bond prices, yield movements, news alerts—and analytical tools tailored specifically for fixed-income markets.
These platforms also provide access to historical data trends which help traders analyze patterns over time—crucial for developing effective strategies around spread movements during volatile periods or economic cycles.
Advanced Trading Software & Platforms
Modern trading software enhances decision-making by integrating multiple data sources into user-friendly interfaces that facilitate trade execution directly from analysis screens:
- Bloomberg Terminal: Offers extensive analytics on bond markets alongside customizable dashboards.
- Reuters Eikon: Provides real-time quotes combined with news updates relevant for fixed-income securities.
- Proprietary Trading Platforms: Many financial institutions develop their own systems optimized for specific strategies such as pair trades involving different segments within the debt market.
These platforms often include features like scenario analysis (stress testing), automated alerts based on preset criteria (e.g., spread thresholds), and order execution capabilities—all critical components when managing complex options around credit spread fluctuations efficiently.
Emerging Technologies Impacting Credit Spread Trading
Recent technological advancements have further empowered traders through machine learning algorithms capable of analyzing vast datasets faster than traditional methods—identifying subtle patterns indicating potential shifts in spread dynamics before they become apparent publicly.
Artificial intelligence-driven models now assist with predictive analytics regarding default probabilities or macroeconomic impacts influencing sector-specific risks—a significant advantage given how swiftly sentiment can change during periods of heightened volatility such as during global crises or regulatory shifts.
Summary: Essential Tools Every Trader Should Know
To succeed at trading credit spreads effectively:
- Use benchmark indices like Barclays High Yield Index & Investment Grade Index
- Analyze yield curves regularly
- Monitor updates from reputable rating agencies
- Leverage real-time financial news platforms
- Utilize advanced software solutions tailored for fixed-income analysis
- Keep abreast with emerging AI-driven analytics technologies
Combining these resources allows traders not only to interpret current market conditions but also anticipate future movements—an essential skill given how sensitive this segment is to macroeconomic factors ranging from central bank policies to geopolitical tensions.
Final Thoughts on Building Expertise in Credit Spread Trading Tools
Developing proficiency with these tools enhances your ability to make informed decisions rooted in sound analysis rather than speculation alone. As markets evolve—with increasing automation and sophisticated data modeling—the importance lies not just in having access but understanding how best leverage each resource within your overall strategy framework.
By integrating index benchmarks, yield curve insights, ratings assessments, real-time news feeds—and embracing innovative tech solutions—you position yourself better equipped against unpredictable swings inherent within fixed-income markets’ complex landscape.
Stay informed. Stay prepared. Trade smarter.
Disclaimer:Contains third-party content. Not financial advice.
See Terms and Conditions.
How Does a Credit Spread Work?
Understanding how credit spreads function is essential for investors and market participants who want to gauge the risk and return profile of fixed-income securities. At its core, a credit spread represents the difference in yield between two bonds with different credit qualities, serving as a key indicator of perceived risk in the bond market.
What Is a Credit Spread?
A credit spread is essentially the extra yield that investors demand to compensate for taking on additional credit risk associated with lower-rated bonds. When comparing two bonds—say, one investment-grade corporate bond and another high-yield (junk) bond—the difference in their yields reflects how much more investors require to hold the riskier asset. This differential is expressed in basis points (bps), where 100 bps equals 1%.
For example, if a AAA-rated government bond yields 2%, and a BBB-rated corporate bond yields 4%, then the credit spread between them is 200 bps. This spread indicates that investors see higher default risk in BBB bonds compared to safer government securities.
Factors Influencing Credit Spreads
Several factors influence how wide or narrow these spreads are at any given time:
Economic Conditions: During economic downturns or periods of uncertainty, investors tend to become more risk-averse, leading to wider spreads as they demand higher compensation for increased default risks.
Interest Rate Environment: Changes in benchmark interest rates affect overall borrowing costs but can also impact spreads depending on monetary policy stance.
Issuer-Specific Factors: The financial health and outlook of individual issuers directly influence their perceived creditworthiness; deteriorating fundamentals typically cause spreads to widen.
Market Sentiment & Risk Appetite: Investor confidence levels play a crucial role; heightened fears about defaults or economic slowdown often lead to increased spreads.
Types of Credit Spreads
Credit spreads are observable across various segments within fixed-income markets:
Corporate Bonds: Differentiated by industry sector, rating category (investment grade vs. high-yield), and maturity.
Municipal Bonds: Variations depend on issuer stability and regional economic health.
Sovereign Bonds: Spreads reflect country-specific risks such as political stability or fiscal health.
Each type provides insights into specific market segments' perceived risks relative to safer benchmarks like government securities.
Recent Trends & Market Dynamics
As of mid-2025, recent developments highlight some interesting dynamics around credit spreads:
Despite volatility seen elsewhere—particularly in government bond markets—credit spreads for high-yield US corporate bonds have remained relatively stable[1]. This resilience suggests that investor appetite for higher-risk assets persists even amid broader market turbulence.
However, persistent uncertainties related to U.S. fiscal policies and trade tensions continue influencing investor behavior[2]. These uncertainties tend to increase caution among fixed-income investors, potentially leading toward wider spreads if concerns escalate further.
Market volatility combined with inflation worries has heightened focus on potential widening of credit spreads[5], which could signal rising default risks or shifts toward more conservative investment strategies.
Why Do Widening Credit Spreads Matter?
Widening credit spreads serve as an important signal within financial markets:
They indicate increased perceptions of default risk among borrowers.
They can lead directly to higher borrowing costs for companies seeking debt financing; this may impact their profitability or ability to fund growth initiatives.
For fixed-income funds heavily invested in lower-rated assets, widening spreads often translate into increased volatility and potential losses if defaults rise sharply.
From an economic perspective, sustained widening may foreshadow downturns since it reflects growing investor concern about overall financial stability[3].
How Investors Use Credit Spreads
Investors monitor changes in credit spreads closely because they offer valuable insights into market sentiment:
As an Indicator:
Widening — signals increasing perceived risks; possibly precedes economic slowdowns or recessions.
Narrowing — suggests improving confidence; potentially indicates stable growth prospects.
In Portfolio Management:
Investors adjust their holdings based on spread movements—reducing exposure during periods when signs point toward rising defaults while increasing allocations when conditions improve[4].
Risk Management:
Credit derivatives like CDS (credit default swaps) are often used alongside spread analysis for hedging against potential defaults.
Final Thoughts: The Significance of Monitoring Credit Spreads
Understanding how credit spreads work provides critical insight into both individual security valuation and broader macroeconomic trends. As recent data shows stability amidst volatility—and ongoing geopolitical uncertainties—the importance lies not only in current levels but also in tracking future movements carefully[6].
By paying attention to these indicators through fundamental analysis combined with macroeconomic context—including interest rate trends—they help create informed investment decisions aligned with your risk tolerance goals.
References
- Market Stability Report June 2025
- U.S. Fiscal Policy Uncertainty Analysis June 2025
- Economic Indicators & Default Risks July 2025
- Portfolio Strategies Amid Spread Fluctuations August 2025
- Inflation Impact on Bond Markets June-July 20256.. Financial Market Outlook Q3-Q4 2025
JCUSER-F1IIaxXA
2025-06-09 21:52
How does a credit spread work?
How Does a Credit Spread Work?
Understanding how credit spreads function is essential for investors and market participants who want to gauge the risk and return profile of fixed-income securities. At its core, a credit spread represents the difference in yield between two bonds with different credit qualities, serving as a key indicator of perceived risk in the bond market.
What Is a Credit Spread?
A credit spread is essentially the extra yield that investors demand to compensate for taking on additional credit risk associated with lower-rated bonds. When comparing two bonds—say, one investment-grade corporate bond and another high-yield (junk) bond—the difference in their yields reflects how much more investors require to hold the riskier asset. This differential is expressed in basis points (bps), where 100 bps equals 1%.
For example, if a AAA-rated government bond yields 2%, and a BBB-rated corporate bond yields 4%, then the credit spread between them is 200 bps. This spread indicates that investors see higher default risk in BBB bonds compared to safer government securities.
Factors Influencing Credit Spreads
Several factors influence how wide or narrow these spreads are at any given time:
Economic Conditions: During economic downturns or periods of uncertainty, investors tend to become more risk-averse, leading to wider spreads as they demand higher compensation for increased default risks.
Interest Rate Environment: Changes in benchmark interest rates affect overall borrowing costs but can also impact spreads depending on monetary policy stance.
Issuer-Specific Factors: The financial health and outlook of individual issuers directly influence their perceived creditworthiness; deteriorating fundamentals typically cause spreads to widen.
Market Sentiment & Risk Appetite: Investor confidence levels play a crucial role; heightened fears about defaults or economic slowdown often lead to increased spreads.
Types of Credit Spreads
Credit spreads are observable across various segments within fixed-income markets:
Corporate Bonds: Differentiated by industry sector, rating category (investment grade vs. high-yield), and maturity.
Municipal Bonds: Variations depend on issuer stability and regional economic health.
Sovereign Bonds: Spreads reflect country-specific risks such as political stability or fiscal health.
Each type provides insights into specific market segments' perceived risks relative to safer benchmarks like government securities.
Recent Trends & Market Dynamics
As of mid-2025, recent developments highlight some interesting dynamics around credit spreads:
Despite volatility seen elsewhere—particularly in government bond markets—credit spreads for high-yield US corporate bonds have remained relatively stable[1]. This resilience suggests that investor appetite for higher-risk assets persists even amid broader market turbulence.
However, persistent uncertainties related to U.S. fiscal policies and trade tensions continue influencing investor behavior[2]. These uncertainties tend to increase caution among fixed-income investors, potentially leading toward wider spreads if concerns escalate further.
Market volatility combined with inflation worries has heightened focus on potential widening of credit spreads[5], which could signal rising default risks or shifts toward more conservative investment strategies.
Why Do Widening Credit Spreads Matter?
Widening credit spreads serve as an important signal within financial markets:
They indicate increased perceptions of default risk among borrowers.
They can lead directly to higher borrowing costs for companies seeking debt financing; this may impact their profitability or ability to fund growth initiatives.
For fixed-income funds heavily invested in lower-rated assets, widening spreads often translate into increased volatility and potential losses if defaults rise sharply.
From an economic perspective, sustained widening may foreshadow downturns since it reflects growing investor concern about overall financial stability[3].
How Investors Use Credit Spreads
Investors monitor changes in credit spreads closely because they offer valuable insights into market sentiment:
As an Indicator:
Widening — signals increasing perceived risks; possibly precedes economic slowdowns or recessions.
Narrowing — suggests improving confidence; potentially indicates stable growth prospects.
In Portfolio Management:
Investors adjust their holdings based on spread movements—reducing exposure during periods when signs point toward rising defaults while increasing allocations when conditions improve[4].
Risk Management:
Credit derivatives like CDS (credit default swaps) are often used alongside spread analysis for hedging against potential defaults.
Final Thoughts: The Significance of Monitoring Credit Spreads
Understanding how credit spreads work provides critical insight into both individual security valuation and broader macroeconomic trends. As recent data shows stability amidst volatility—and ongoing geopolitical uncertainties—the importance lies not only in current levels but also in tracking future movements carefully[6].
By paying attention to these indicators through fundamental analysis combined with macroeconomic context—including interest rate trends—they help create informed investment decisions aligned with your risk tolerance goals.
References
- Market Stability Report June 2025
- U.S. Fiscal Policy Uncertainty Analysis June 2025
- Economic Indicators & Default Risks July 2025
- Portfolio Strategies Amid Spread Fluctuations August 2025
- Inflation Impact on Bond Markets June-July 20256.. Financial Market Outlook Q3-Q4 2025
Disclaimer:Contains third-party content. Not financial advice.
See Terms and Conditions.
How to Earn Free OBOL Tokens: A Complete Guide
Understanding OBOL Tokens and Their Value
OBOL is a decentralized cryptocurrency built on a blockchain network that emphasizes transparency, security, and community participation. It is designed to facilitate peer-to-peer transactions while offering various incentives for users through its ecosystem. The OBOL token serves multiple functions, including paying transaction fees, earning staking rewards, and participating in governance decisions that influence the platform’s future development.
As with many emerging cryptocurrencies, one of the most attractive aspects for new users is the opportunity to earn free OBOL tokens. These tokens can be obtained through several methods that do not require an initial investment but instead rely on active engagement within the OBOL community or participation in specific campaigns.
Key Methods to Earn Free OBOL Tokens
1. Participating in Airdrops
Airdrops are one of the most common ways for new users to receive free tokens from blockchain projects like OBOL. Typically announced via official channels such as the project’s website or social media pages (Twitter, Telegram), airdrops involve distributing free tokens directly into eligible wallets. To participate:
- Follow official OBOL social media accounts.
- Register your wallet address on their platform if required.
- Complete any specified tasks such as verifying your identity or joining their community groups.
Airdrops serve both as promotional tools and ways to distribute tokens broadly among potential users who might later become active participants in the ecosystem.
2. Referral Programs
Referral programs incentivize existing users to invite others into the platform by offering rewards—often in the form of free tokens—for each successful referral. For example:
- Share your unique referral link with friends interested in cryptocurrency.
- When they sign up and meet certain criteria (like completing KYC or making a transaction), you earn additional OBOL tokens.
This method leverages network effects and helps expand user adoption while rewarding loyal members of the community.
3. Bounty Campaigns and Community Tasks
Bounty campaigns are another effective way to earn free OBOL tokens by contributing value back to the project:
- Translating whitepapers or marketing materials into different languages.
- Creating content such as articles, videos, or social media posts about OBOL.
- Participating actively in online forums or discussion groups related to blockchain technology.
These activities help increase awareness about OBOL while rewarding contributors with tokens proportional to their effort.
4. Staking for Rewards
Staking involves locking up a certain amount of existing coins within a designated wallet or platform interface for a set period—earning additional rewards over time as compensation for supporting network security and stability. If available with OBOL:
- Stake your current holdings through official platforms.
- Receive periodic staking rewards which may include additional free ORBIL tokens depending on campaign rules.
Staking not only provides passive income opportunities but also aligns user interests with long-term project success.
5. Engaging With Community Platforms
Active involvement within communities—such as forums like Reddit, Telegram groups, Discord servers—can sometimes lead to exclusive opportunities like early access features or special giveaways involving free token distributions. Staying informed about updates from official sources ensures you don’t miss out on these chances.
Why These Methods Matter: Building Trust & Long-Term Value
Participating actively across these avenues demonstrates genuine interest rather than speculative behavior alone—a key factor aligning with principles of transparency and decentralization central to blockchain projects like OBOL . Such engagement fosters trustworthiness (E-A-T) essential when considering investments; it also helps you stay updated on regulatory changes that could impact token distribution policies.
Risks & Considerations When Earning Free Tokens
While earning free OBSL can be appealing, it’s important not just focus solely on immediate gains but also consider potential risks involved:
- Regulatory Environment: Changes in laws governing cryptocurrencies could restrict some distribution methods such as airdrops or bounty campaigns.
- Market Volatility: Cryptocurrency prices fluctuate rapidly; even earned tokens might lose significant value if market conditions turn unfavorable.
- Security Concerns: Always verify sources before sharing personal information; beware of scams promising “free” coins requiring sensitive data.
Final Thoughts: Maximize Your Opportunities Responsibly
Earning free OPBL involves engaging actively through multiple channels—from participating in official airdrops and referral programs to contributing content via bounty campaigns—and staying informed about ongoing developments within its ecosystem . By doing so responsibly—with attention toward security practices—you can build both your holdings and understanding of decentralized finance platforms effectively.
Keywords: earn free ObolTokens | ObolToken distribution | crypto giveaways | staking rewards | DeFi incentives | blockchain community engagement
JCUSER-WVMdslBw
2025-06-09 20:34
What are the steps to earn free OBOL tokens?
How to Earn Free OBOL Tokens: A Complete Guide
Understanding OBOL Tokens and Their Value
OBOL is a decentralized cryptocurrency built on a blockchain network that emphasizes transparency, security, and community participation. It is designed to facilitate peer-to-peer transactions while offering various incentives for users through its ecosystem. The OBOL token serves multiple functions, including paying transaction fees, earning staking rewards, and participating in governance decisions that influence the platform’s future development.
As with many emerging cryptocurrencies, one of the most attractive aspects for new users is the opportunity to earn free OBOL tokens. These tokens can be obtained through several methods that do not require an initial investment but instead rely on active engagement within the OBOL community or participation in specific campaigns.
Key Methods to Earn Free OBOL Tokens
1. Participating in Airdrops
Airdrops are one of the most common ways for new users to receive free tokens from blockchain projects like OBOL. Typically announced via official channels such as the project’s website or social media pages (Twitter, Telegram), airdrops involve distributing free tokens directly into eligible wallets. To participate:
- Follow official OBOL social media accounts.
- Register your wallet address on their platform if required.
- Complete any specified tasks such as verifying your identity or joining their community groups.
Airdrops serve both as promotional tools and ways to distribute tokens broadly among potential users who might later become active participants in the ecosystem.
2. Referral Programs
Referral programs incentivize existing users to invite others into the platform by offering rewards—often in the form of free tokens—for each successful referral. For example:
- Share your unique referral link with friends interested in cryptocurrency.
- When they sign up and meet certain criteria (like completing KYC or making a transaction), you earn additional OBOL tokens.
This method leverages network effects and helps expand user adoption while rewarding loyal members of the community.
3. Bounty Campaigns and Community Tasks
Bounty campaigns are another effective way to earn free OBOL tokens by contributing value back to the project:
- Translating whitepapers or marketing materials into different languages.
- Creating content such as articles, videos, or social media posts about OBOL.
- Participating actively in online forums or discussion groups related to blockchain technology.
These activities help increase awareness about OBOL while rewarding contributors with tokens proportional to their effort.
4. Staking for Rewards
Staking involves locking up a certain amount of existing coins within a designated wallet or platform interface for a set period—earning additional rewards over time as compensation for supporting network security and stability. If available with OBOL:
- Stake your current holdings through official platforms.
- Receive periodic staking rewards which may include additional free ORBIL tokens depending on campaign rules.
Staking not only provides passive income opportunities but also aligns user interests with long-term project success.
5. Engaging With Community Platforms
Active involvement within communities—such as forums like Reddit, Telegram groups, Discord servers—can sometimes lead to exclusive opportunities like early access features or special giveaways involving free token distributions. Staying informed about updates from official sources ensures you don’t miss out on these chances.
Why These Methods Matter: Building Trust & Long-Term Value
Participating actively across these avenues demonstrates genuine interest rather than speculative behavior alone—a key factor aligning with principles of transparency and decentralization central to blockchain projects like OBOL . Such engagement fosters trustworthiness (E-A-T) essential when considering investments; it also helps you stay updated on regulatory changes that could impact token distribution policies.
Risks & Considerations When Earning Free Tokens
While earning free OBSL can be appealing, it’s important not just focus solely on immediate gains but also consider potential risks involved:
- Regulatory Environment: Changes in laws governing cryptocurrencies could restrict some distribution methods such as airdrops or bounty campaigns.
- Market Volatility: Cryptocurrency prices fluctuate rapidly; even earned tokens might lose significant value if market conditions turn unfavorable.
- Security Concerns: Always verify sources before sharing personal information; beware of scams promising “free” coins requiring sensitive data.
Final Thoughts: Maximize Your Opportunities Responsibly
Earning free OPBL involves engaging actively through multiple channels—from participating in official airdrops and referral programs to contributing content via bounty campaigns—and staying informed about ongoing developments within its ecosystem . By doing so responsibly—with attention toward security practices—you can build both your holdings and understanding of decentralized finance platforms effectively.
Keywords: earn free ObolTokens | ObolToken distribution | crypto giveaways | staking rewards | DeFi incentives | blockchain community engagement
Disclaimer:Contains third-party content. Not financial advice.
See Terms and Conditions.
Recent Bitcoin Rally and Its Effect on Bearish Market Positions
Understanding the Impact of Bitcoin’s Price Surge on Short-Selling Strategies
The recent rally in Bitcoin (BTC) has captured significant attention within the cryptocurrency community and financial markets at large. On June 8, 2025, Bitcoin surged to a new high of $105,460, representing a 2.36% increase from the previous day. This sharp upward movement has not only influenced market sentiment but also reshaped investor behavior—particularly among those holding bearish bets or short positions.
How Price Movements Influence Market Sentiment
Bitcoin’s rapid price appreciation often triggers shifts in investor outlooks. Historically, such rallies tend to reduce bearish sentiment as traders become more optimistic about future gains. The current rally exemplifies this trend: many investors who previously anticipated a decline are now reconsidering their positions. As a result, there has been a notable decrease in bearish bets—investors are closing short positions or converting them into long ones to capitalize on the bullish momentum.
Futures Contracts Indicate Continued Optimism
Despite the rally's immediate effects on spot trading and investor sentiment, futures markets reveal an even more bullish outlook among certain segments of traders. Futures contracts with higher premiums suggest that some investors still believe in potential further increases in Bitcoin’s price down the line. These derivatives serve as indicators of market expectations for future volatility and growth; elevated premiums imply confidence that prices could rise beyond current levels.
The Role of ETFs During Market Fluctuations
Exchange-traded funds (ETFs), which provide exposure to cryptocurrencies without direct ownership, have shown nearly flat performance during this period. This stability indicates mixed sentiments: while some investors remain optimistic about short-term gains driven by recent rallies, others exhibit caution regarding long-term stability amid ongoing market uncertainties. ETFs’ muted response underscores that not all market participants are uniformly convinced about sustained upward momentum.
Investor Behavior Shifts Amid Price Surges
The surge in Bitcoin's value has prompted significant behavioral changes among traders and institutional investors alike:
- Closing Short Positions: Traders who bet against BTC are increasingly liquidating their shorts.
- Increasing Long Positions: Many are shifting strategies toward buying or holding long positions to benefit from continued growth.
- Adjusting Risk Tolerance: Investors appear more willing to accept higher risk levels given positive recent trends.
This collective shift reflects an overarching move toward optimism but also highlights increased vulnerability if prices reverse suddenly.
Broader Cryptocurrency Market Trends Supporting Bullish Sentiment
Bitcoin does not operate in isolation; its movements often influence broader crypto markets:
- Growing interest from institutional investors
- Increased retail participation
- Rising adoption rates across various sectors
These factors contribute to overall bullish trends within cryptocurrencies and help explain why bearish bets have diminished during this rally phase.
Potential Risks Associated With Rapid Market Changes
While rising prices can generate profit opportunities, they also carry inherent risks:
- Market Volatility: Rapid surges can lead to sharp corrections if investor enthusiasm wanes unexpectedly.
- Overleveraging: Elevated futures premiums may encourage risky leverage strategies that amplify losses during downturns.
- Market Manipulation Concerns: Sudden price spikes sometimes attract manipulative practices which can distort true market fundamentals.
Investors should remain cautious and employ risk management techniques when navigating such volatile environments.
Historical Context: Cycles of Bullish Rallies and Corrections
Cryptocurrency markets have historically experienced cycles characterized by rapid rallies followed by corrections:
- Past bull runs were often preceded by accumulation phases where bearish bets declined sharply.
- Corrections typically follow after speculative excesses or macroeconomic shifts.
Understanding these patterns helps contextualize current developments—highlighting that while optimism is justified now, prudence remains essential due to past volatility cycles.
Expert Forecasts on Future Trends
Financial analysts closely monitor these developments for signs of sustainability:
- Some experts predict continued upward momentum if institutional interest persists
- Others warn against overexposure amid potential correction risks
Overall consensus emphasizes balancing optimism with caution—recognizing that while recent gains boost confidence temporarily, underlying fundamentals must support sustained growth for lasting market health.
Monitoring Investor Strategies Moving Forward
As Bitcoin continues its upward trajectory post-rally:
- Investors should stay informed about macroeconomic factors influencing crypto markets
- Diversification remains key amidst fluctuating sentiment
- Regularly reviewing open positions helps manage exposure effectively
Adapting strategies based on evolving data ensures better resilience against sudden reversals typical of volatile cryptocurrency environments.
Tracking Broader Economic Indicators Affecting Crypto Markets
Beyond internal crypto dynamics, external economic variables play crucial roles:
- Currency exchange rates (e.g., SGD/CHF)
- Regulatory developments worldwide
- Macroeconomic policies impacting liquidity
For example, fluctuations like those seen recently between SGD/CHF reflect ongoing global financial activity influencing investment flows into cryptocurrencies like BTC.
How Recent Rally Shapes Long-Term Investment Outlook
The swift shift from bearishness toward optimism following BTC’s rally signifies changing perceptions among both retail and institutional players alike. While this environment offers promising opportunities for profit-taking or portfolio diversification,
it is vital for investors—and especially newcomers—to approach with due diligence,
considering both technical signals (such as moving averages) and fundamental factors (like network adoption). Maintaining awareness of historical patterns helps mitigate risks associated with sudden corrections after rapid surges.
Staying Informed Is Key During Volatile Periods
Given how quickly sentiment can change—as evidenced by past cycles—it is essential for stakeholders at all levels:
- To follow credible news sources covering regulatory updates,
- To analyze technical charts regularly,
- To understand macroeconomic influences shaping crypto valuations,
This comprehensive approach enables better decision-making amid unpredictable swings characteristic of cryptocurrency markets.
In summary,
the recent Bitcoin rally has significantly altered trader positioning—from widespread bearish bets towards increased bullishness—reflecting heightened confidence driven by rising prices and positive market signals. However,investors must remain vigilant regarding potential volatility spikes,continuously adapt their strategies based on evolving data,and maintain a balanced perspective rooted in historical context when navigating these dynamic digital asset landscapes
JCUSER-WVMdslBw
2025-06-09 20:03
How did the recent BTC rally impact bearish bets in the market?
Recent Bitcoin Rally and Its Effect on Bearish Market Positions
Understanding the Impact of Bitcoin’s Price Surge on Short-Selling Strategies
The recent rally in Bitcoin (BTC) has captured significant attention within the cryptocurrency community and financial markets at large. On June 8, 2025, Bitcoin surged to a new high of $105,460, representing a 2.36% increase from the previous day. This sharp upward movement has not only influenced market sentiment but also reshaped investor behavior—particularly among those holding bearish bets or short positions.
How Price Movements Influence Market Sentiment
Bitcoin’s rapid price appreciation often triggers shifts in investor outlooks. Historically, such rallies tend to reduce bearish sentiment as traders become more optimistic about future gains. The current rally exemplifies this trend: many investors who previously anticipated a decline are now reconsidering their positions. As a result, there has been a notable decrease in bearish bets—investors are closing short positions or converting them into long ones to capitalize on the bullish momentum.
Futures Contracts Indicate Continued Optimism
Despite the rally's immediate effects on spot trading and investor sentiment, futures markets reveal an even more bullish outlook among certain segments of traders. Futures contracts with higher premiums suggest that some investors still believe in potential further increases in Bitcoin’s price down the line. These derivatives serve as indicators of market expectations for future volatility and growth; elevated premiums imply confidence that prices could rise beyond current levels.
The Role of ETFs During Market Fluctuations
Exchange-traded funds (ETFs), which provide exposure to cryptocurrencies without direct ownership, have shown nearly flat performance during this period. This stability indicates mixed sentiments: while some investors remain optimistic about short-term gains driven by recent rallies, others exhibit caution regarding long-term stability amid ongoing market uncertainties. ETFs’ muted response underscores that not all market participants are uniformly convinced about sustained upward momentum.
Investor Behavior Shifts Amid Price Surges
The surge in Bitcoin's value has prompted significant behavioral changes among traders and institutional investors alike:
- Closing Short Positions: Traders who bet against BTC are increasingly liquidating their shorts.
- Increasing Long Positions: Many are shifting strategies toward buying or holding long positions to benefit from continued growth.
- Adjusting Risk Tolerance: Investors appear more willing to accept higher risk levels given positive recent trends.
This collective shift reflects an overarching move toward optimism but also highlights increased vulnerability if prices reverse suddenly.
Broader Cryptocurrency Market Trends Supporting Bullish Sentiment
Bitcoin does not operate in isolation; its movements often influence broader crypto markets:
- Growing interest from institutional investors
- Increased retail participation
- Rising adoption rates across various sectors
These factors contribute to overall bullish trends within cryptocurrencies and help explain why bearish bets have diminished during this rally phase.
Potential Risks Associated With Rapid Market Changes
While rising prices can generate profit opportunities, they also carry inherent risks:
- Market Volatility: Rapid surges can lead to sharp corrections if investor enthusiasm wanes unexpectedly.
- Overleveraging: Elevated futures premiums may encourage risky leverage strategies that amplify losses during downturns.
- Market Manipulation Concerns: Sudden price spikes sometimes attract manipulative practices which can distort true market fundamentals.
Investors should remain cautious and employ risk management techniques when navigating such volatile environments.
Historical Context: Cycles of Bullish Rallies and Corrections
Cryptocurrency markets have historically experienced cycles characterized by rapid rallies followed by corrections:
- Past bull runs were often preceded by accumulation phases where bearish bets declined sharply.
- Corrections typically follow after speculative excesses or macroeconomic shifts.
Understanding these patterns helps contextualize current developments—highlighting that while optimism is justified now, prudence remains essential due to past volatility cycles.
Expert Forecasts on Future Trends
Financial analysts closely monitor these developments for signs of sustainability:
- Some experts predict continued upward momentum if institutional interest persists
- Others warn against overexposure amid potential correction risks
Overall consensus emphasizes balancing optimism with caution—recognizing that while recent gains boost confidence temporarily, underlying fundamentals must support sustained growth for lasting market health.
Monitoring Investor Strategies Moving Forward
As Bitcoin continues its upward trajectory post-rally:
- Investors should stay informed about macroeconomic factors influencing crypto markets
- Diversification remains key amidst fluctuating sentiment
- Regularly reviewing open positions helps manage exposure effectively
Adapting strategies based on evolving data ensures better resilience against sudden reversals typical of volatile cryptocurrency environments.
Tracking Broader Economic Indicators Affecting Crypto Markets
Beyond internal crypto dynamics, external economic variables play crucial roles:
- Currency exchange rates (e.g., SGD/CHF)
- Regulatory developments worldwide
- Macroeconomic policies impacting liquidity
For example, fluctuations like those seen recently between SGD/CHF reflect ongoing global financial activity influencing investment flows into cryptocurrencies like BTC.
How Recent Rally Shapes Long-Term Investment Outlook
The swift shift from bearishness toward optimism following BTC’s rally signifies changing perceptions among both retail and institutional players alike. While this environment offers promising opportunities for profit-taking or portfolio diversification,
it is vital for investors—and especially newcomers—to approach with due diligence,
considering both technical signals (such as moving averages) and fundamental factors (like network adoption). Maintaining awareness of historical patterns helps mitigate risks associated with sudden corrections after rapid surges.
Staying Informed Is Key During Volatile Periods
Given how quickly sentiment can change—as evidenced by past cycles—it is essential for stakeholders at all levels:
- To follow credible news sources covering regulatory updates,
- To analyze technical charts regularly,
- To understand macroeconomic influences shaping crypto valuations,
This comprehensive approach enables better decision-making amid unpredictable swings characteristic of cryptocurrency markets.
In summary,
the recent Bitcoin rally has significantly altered trader positioning—from widespread bearish bets towards increased bullishness—reflecting heightened confidence driven by rising prices and positive market signals. However,investors must remain vigilant regarding potential volatility spikes,continuously adapt their strategies based on evolving data,and maintain a balanced perspective rooted in historical context when navigating these dynamic digital asset landscapes
Disclaimer:Contains third-party content. Not financial advice.
See Terms and Conditions.
How the Crypto Fear & Greed Index Helps Traders Make Better Decisions
Understanding market sentiment is crucial for successful trading, especially in the highly volatile world of cryptocurrencies. The Crypto Fear & Greed Index offers traders a valuable tool to gauge investor emotions and anticipate potential market movements. By analyzing this index, traders can enhance their decision-making process, manage risks more effectively, and identify optimal entry and exit points.
What Is the Crypto Fear & Greed Index?
The Crypto Fear & Greed Index is an algorithmic indicator designed to measure the overall sentiment of cryptocurrency investors. Created by Alternative.me in 2018, it synthesizes various data points—such as price volatility, trading volume, social media activity (like Twitter sentiment), and market capitalization—to produce a single score reflecting current market emotions. This score ranges from 0 to 100: lower values indicate fear or panic selling among investors; higher values suggest greed or overconfidence.
This index mirrors similar tools used in traditional financial markets but tailored specifically for cryptocurrencies' unique dynamics. Its primary purpose is to provide traders with a quick snapshot of whether the market is overly fearful or excessively greedy—conditions that often precede significant price reversals.
How Does the Index Work?
The index operates on a scale from 0 to 100:
- 0-24: Extreme Fear – Investors are panicking; prices may be undervalued.
- 25-49: Fear – Caution prevails; some selling pressure exists.
- 50: Neutral – Market shows balanced sentiment.
- 51-74: Greed – Optimism increases; prices might be overbought.
- 75-100: Extreme Greed – Overconfidence dominates; risk of correction rises.
Traders interpret these signals differently depending on their strategies. For example, extreme fear levels might signal buying opportunities due to potential undervaluation, while extreme greed could warn against entering new long positions or suggest taking profits.
Why Is Sentiment Analysis Important in Cryptocurrency Trading?
Cryptocurrency markets are known for their high volatility driven not only by technical factors but also by emotional reactions among investors. FOMO (Fear Of Missing Out), panic selling during downturns, and exuberance during rallies can all lead to irrational decision-making that deviates from fundamental analysis.
Sentiment analysis tools like the Crypto Fear & Greed Index help traders cut through emotional noise by providing objective data about prevailing investor moods. Recognizing when markets are overly fearful can present contrarian buying opportunities—buy low scenarios—while identifying excessive greed may prompt caution or profit-taking before a correction occurs.
Practical Ways Traders Use the Index
Traders incorporate the Crypto Fear & Greed Index into their strategies through various approaches:
- Contrarian Investing: Buying when fear levels are high (index below 25) with expectations of rebound.
- Profit Taking: Selling or reducing exposure when greed levels reach extremes (above 75).
- Market Timing: Combining index signals with technical analysis for more precise entries/exits.
- Risk Management: Adjusting position sizes based on current sentiment—smaller trades during uncertain times and larger ones when confidence is high.
Additionally, many traders use historical patterns observed via this index as part of broader trend analysis models aimed at predicting future movements based on past behavior under similar sentiment conditions.
Limitations and Risks
While valuable, reliance solely on the Crypto Fear & Greed Index has its pitfalls:
It provides a snapshot rather than comprehensive insight into fundamentals such as project development progress or macroeconomic factors influencing crypto prices.
Market sentiments can remain irrational longer than expected—a phenomenon known as "market timing risk."
Overreacting to short-term swings in sentiment may lead traders astray if they ignore underlying asset fundamentals or broader economic indicators.
Therefore, it's essential for traders to combine this tool with other forms of analysis—including technical charts, news events tracking, macroeconomic data—and maintain disciplined risk management practices.
Recent Trends Enhancing Its Effectiveness
In recent years, technological advancements have improved how accurately this index reflects real-time market psychology:
The integration of machine learning algorithms allows for better pattern recognition across diverse data sources such as social media trends and trading volumes.
Updates introduced by Alternative.me have expanded data inputs beyond basic metrics—for example incorporating network activity metrics—to refine sentiment assessment further.
These improvements make it easier for traders to interpret current conditions more reliably than ever before while adapting quickly during rapid shifts like those seen during major events such as exchange collapses or regulatory crackdowns.
Furthermore, increased community engagement around behavioral finance concepts has led many retail investors and institutional players alike to pay closer attention not just individually but collectively—as reflected through indices like these—in shaping overall market dynamics.
By understanding how investor emotions influence cryptocurrency prices—and leveraging tools like the Crypto Fear & Greed Index—traders gain an edge in navigating unpredictable markets. While no single indicator guarantees success alone—the key lies in combining multiple analytical methods—they serve as vital components within a comprehensive trading strategy rooted in informed decision-making rather than impulsive reactions driven purely by emotion.
Keywords:
Crypto Market Sentiment | Cryptocurrency Trading Strategies | Investor Emotions | Technical Analysis | Risk Management | Market Psychology
kai
2025-06-09 19:54
How can the Crypto Fear & Greed Index help traders make better decisions?
How the Crypto Fear & Greed Index Helps Traders Make Better Decisions
Understanding market sentiment is crucial for successful trading, especially in the highly volatile world of cryptocurrencies. The Crypto Fear & Greed Index offers traders a valuable tool to gauge investor emotions and anticipate potential market movements. By analyzing this index, traders can enhance their decision-making process, manage risks more effectively, and identify optimal entry and exit points.
What Is the Crypto Fear & Greed Index?
The Crypto Fear & Greed Index is an algorithmic indicator designed to measure the overall sentiment of cryptocurrency investors. Created by Alternative.me in 2018, it synthesizes various data points—such as price volatility, trading volume, social media activity (like Twitter sentiment), and market capitalization—to produce a single score reflecting current market emotions. This score ranges from 0 to 100: lower values indicate fear or panic selling among investors; higher values suggest greed or overconfidence.
This index mirrors similar tools used in traditional financial markets but tailored specifically for cryptocurrencies' unique dynamics. Its primary purpose is to provide traders with a quick snapshot of whether the market is overly fearful or excessively greedy—conditions that often precede significant price reversals.
How Does the Index Work?
The index operates on a scale from 0 to 100:
- 0-24: Extreme Fear – Investors are panicking; prices may be undervalued.
- 25-49: Fear – Caution prevails; some selling pressure exists.
- 50: Neutral – Market shows balanced sentiment.
- 51-74: Greed – Optimism increases; prices might be overbought.
- 75-100: Extreme Greed – Overconfidence dominates; risk of correction rises.
Traders interpret these signals differently depending on their strategies. For example, extreme fear levels might signal buying opportunities due to potential undervaluation, while extreme greed could warn against entering new long positions or suggest taking profits.
Why Is Sentiment Analysis Important in Cryptocurrency Trading?
Cryptocurrency markets are known for their high volatility driven not only by technical factors but also by emotional reactions among investors. FOMO (Fear Of Missing Out), panic selling during downturns, and exuberance during rallies can all lead to irrational decision-making that deviates from fundamental analysis.
Sentiment analysis tools like the Crypto Fear & Greed Index help traders cut through emotional noise by providing objective data about prevailing investor moods. Recognizing when markets are overly fearful can present contrarian buying opportunities—buy low scenarios—while identifying excessive greed may prompt caution or profit-taking before a correction occurs.
Practical Ways Traders Use the Index
Traders incorporate the Crypto Fear & Greed Index into their strategies through various approaches:
- Contrarian Investing: Buying when fear levels are high (index below 25) with expectations of rebound.
- Profit Taking: Selling or reducing exposure when greed levels reach extremes (above 75).
- Market Timing: Combining index signals with technical analysis for more precise entries/exits.
- Risk Management: Adjusting position sizes based on current sentiment—smaller trades during uncertain times and larger ones when confidence is high.
Additionally, many traders use historical patterns observed via this index as part of broader trend analysis models aimed at predicting future movements based on past behavior under similar sentiment conditions.
Limitations and Risks
While valuable, reliance solely on the Crypto Fear & Greed Index has its pitfalls:
It provides a snapshot rather than comprehensive insight into fundamentals such as project development progress or macroeconomic factors influencing crypto prices.
Market sentiments can remain irrational longer than expected—a phenomenon known as "market timing risk."
Overreacting to short-term swings in sentiment may lead traders astray if they ignore underlying asset fundamentals or broader economic indicators.
Therefore, it's essential for traders to combine this tool with other forms of analysis—including technical charts, news events tracking, macroeconomic data—and maintain disciplined risk management practices.
Recent Trends Enhancing Its Effectiveness
In recent years, technological advancements have improved how accurately this index reflects real-time market psychology:
The integration of machine learning algorithms allows for better pattern recognition across diverse data sources such as social media trends and trading volumes.
Updates introduced by Alternative.me have expanded data inputs beyond basic metrics—for example incorporating network activity metrics—to refine sentiment assessment further.
These improvements make it easier for traders to interpret current conditions more reliably than ever before while adapting quickly during rapid shifts like those seen during major events such as exchange collapses or regulatory crackdowns.
Furthermore, increased community engagement around behavioral finance concepts has led many retail investors and institutional players alike to pay closer attention not just individually but collectively—as reflected through indices like these—in shaping overall market dynamics.
By understanding how investor emotions influence cryptocurrency prices—and leveraging tools like the Crypto Fear & Greed Index—traders gain an edge in navigating unpredictable markets. While no single indicator guarantees success alone—the key lies in combining multiple analytical methods—they serve as vital components within a comprehensive trading strategy rooted in informed decision-making rather than impulsive reactions driven purely by emotion.
Keywords:
Crypto Market Sentiment | Cryptocurrency Trading Strategies | Investor Emotions | Technical Analysis | Risk Management | Market Psychology
Disclaimer:Contains third-party content. Not financial advice.
See Terms and Conditions.